

Whole-body analysis of a viral infection: vascular endothelium is a primary target of infectious hematopoietic necrosis virus in zebrafish larvae
- PMID: 21304884
- PMCID: PMC3033377
- DOI: 10.1371/journal.ppat.1001269
Whole-body analysis of a viral infection: vascular endothelium is a primary target of infectious hematopoietic necrosis virus in zebrafish larvae
Abstract
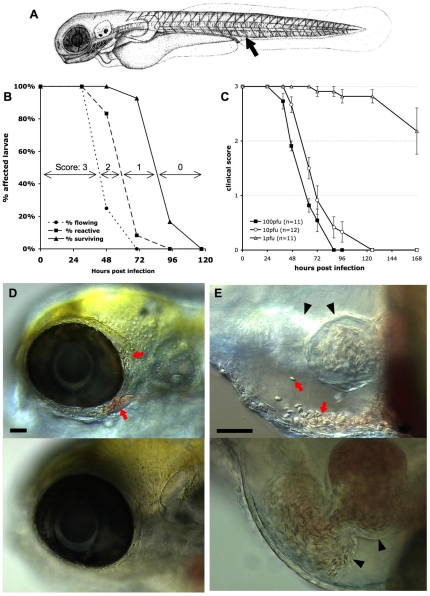
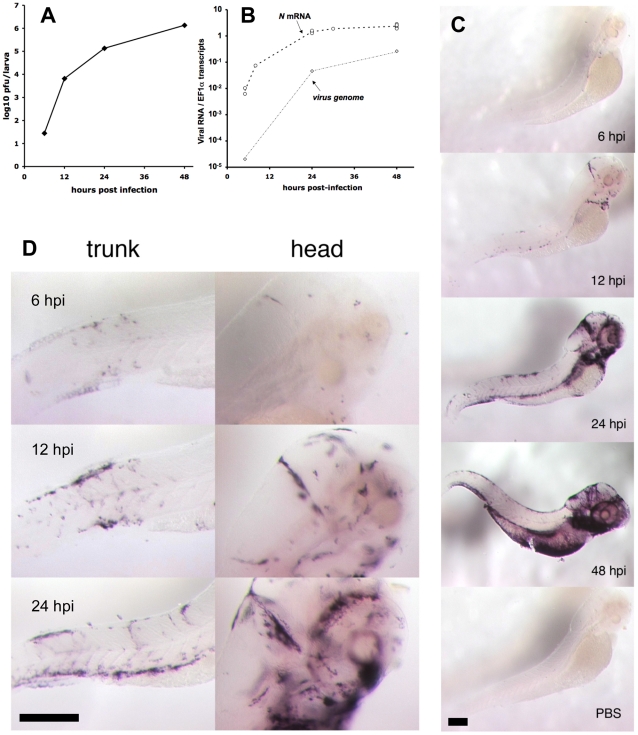
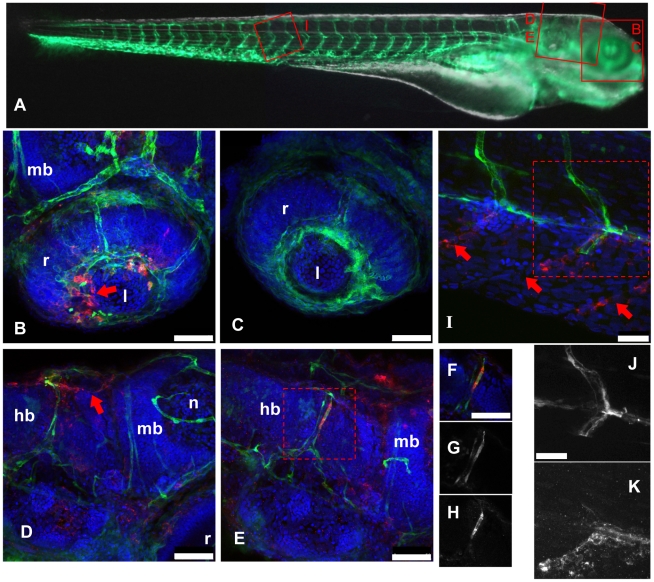
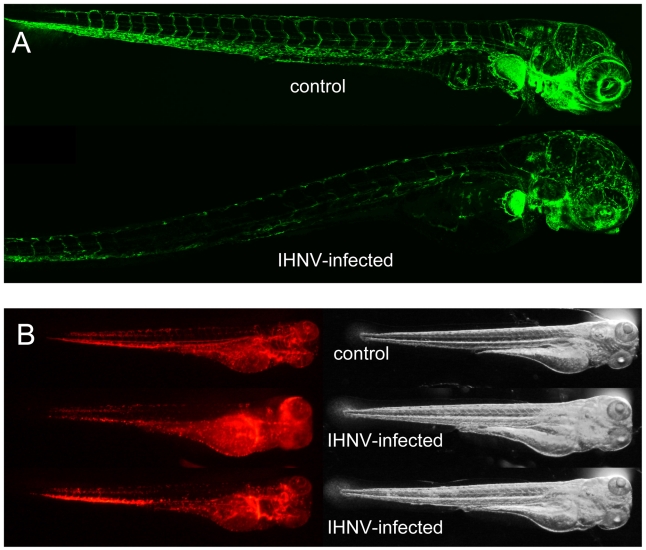
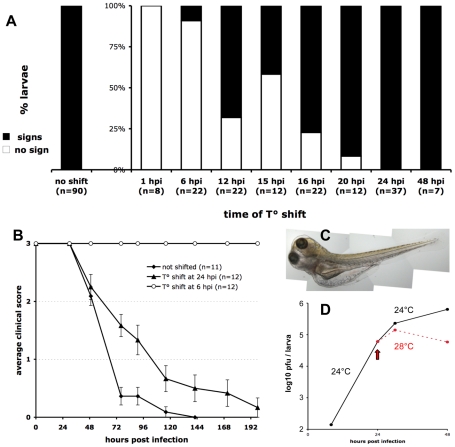
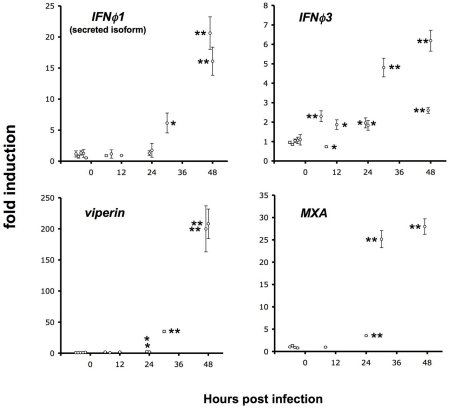
The progression of viral infections is notoriously difficult to follow in whole organisms. The small, transparent zebrafish larva constitutes a valuable system to study how pathogens spread. We describe here the course of infection of zebrafish early larvae with a heat-adapted variant of the Infectious Hematopoietic Necrosis Virus (IHNV), a rhabdovirus that represents an important threat to the salmonid culture industry. When incubated at 24 °C, a permissive temperature for virus replication, larvae infected by intravenous injection died within three to four days. Macroscopic signs of infection followed a highly predictable course, with a slowdown then arrest of blood flow despite continuing heartbeat, followed by a loss of reactivity to touch and ultimately by death. Using whole-mount in situ hybridization, patterns of infection were imaged in whole larvae. The first infected cells were detectable as early as 6 hours post infection, and a steady increase in infected cell number and staining intensity occurred with time. Venous endothelium appeared as a primary target of infection, as could be confirmed in fli1:GFP transgenic larvae by live imaging and immunohistochemistry. Disruption of the first vessels took place before arrest of blood circulation, and hemorrhages could be observed in various places. Our data suggest that infection spread from the damaged vessels to underlying tissue. By shifting infected fish to a temperature of 28 °C that is non-permissive for viral propagation, it was possible to establish when virus-generated damage became irreversible. This stage was reached many hours before any detectable induction of the host response. Zebrafish larvae infected with IHNV constitute a vertebrate model of an hemorrhagic viral disease. This tractable system will allow the in vivo dissection of host-virus interactions at the whole organism scale, a feature unrivalled by other vertebrate models.
Conflict of interest statement
The authors have declared that no competing interests exist.
Figures
Similar articles
-
Viral diseases in zebrafish: what is known and unknown.ILAR J. 2012;53(2):135-43. doi: 10.1093/ilar.53.2.135. ILAR J. 2012. PMID: 23382345 Free PMC article. Review.
-
Infectious pancreatic necrosis virus inhibits infectious hematopoietic necrosis virus at the early stage of infection in a time dependent manner during Co-infection in Chinook salmon embryo cell lines.Fish Shellfish Immunol. 2020 Jul;102:361-367. doi: 10.1016/j.fsi.2020.05.010. Epub 2020 May 6. Fish Shellfish Immunol. 2020. PMID: 32387559
-
Effects of salmonid fish viruses on Mx gene expression and resistance to single or dual viral infections.Fish Shellfish Immunol. 2007 Aug;23(2):390-400. doi: 10.1016/j.fsi.2006.11.012. Epub 2006 Dec 6. Fish Shellfish Immunol. 2007. PMID: 17442587
-
Differential virulence mechanisms of infectious hematopoietic necrosis virus in rainbow trout (Oncorhynchus mykiss) include host entry and virus replication kinetics.J Gen Virol. 2009 Sep;90(Pt 9):2172-82. doi: 10.1099/vir.0.012286-0. Epub 2009 May 27. J Gen Virol. 2009. PMID: 19474249
-
Epidemiological characteristics of infectious hematopoietic necrosis virus (IHNV): a review.Vet Res. 2016 Jun 10;47(1):63. doi: 10.1186/s13567-016-0341-1. Vet Res. 2016. PMID: 27287024 Free PMC article. Review.
Cited by
-
A DN-mda5 transgenic zebrafish model demonstrates that Mda5 plays an important role in snakehead rhabdovirus resistance.Dev Comp Immunol. 2015 Aug;51(2):298-304. doi: 10.1016/j.dci.2015.01.006. Epub 2015 Jan 26. Dev Comp Immunol. 2015. PMID: 25634485 Free PMC article.
-
Evaluation of the pathogenesis and treatment of Mycobacterium marinum infection in zebrafish.Nat Protoc. 2013 Jun;8(6):1114-24. doi: 10.1038/nprot.2013.068. Epub 2013 May 16. Nat Protoc. 2013. PMID: 23680983 Free PMC article.
-
Zebrafish: modeling for herpes simplex virus infections.Zebrafish. 2014 Feb;11(1):17-25. doi: 10.1089/zeb.2013.0920. Epub 2013 Nov 22. Zebrafish. 2014. PMID: 24266790 Free PMC article.
-
Characterisation of a monoclonal antibody detecting Atlantic salmon endothelial and red blood cells, and its association with the infectious salmon anaemia virus cell receptor.J Anat. 2013 May;222(5):547-57. doi: 10.1111/joa.12033. Epub 2013 Feb 25. J Anat. 2013. PMID: 23439106 Free PMC article.
-
Viral diseases in zebrafish: what is known and unknown.ILAR J. 2012;53(2):135-43. doi: 10.1093/ilar.53.2.135. ILAR J. 2012. PMID: 23382345 Free PMC article. Review.
References
-
- Lam S, Chua H, Gong Z, Lam T, Sin Y. Development and maturation of the immune system in zebrafish, Danio rerio: a gene expression profiling, in situ hybridization and immunological study. Dev Comp Immunol. 2003;28:9–28. - PubMed
-
- Herbomel P, Thisse B, Thisse C. Ontogeny and behaviour of early macrophages in the zebrafish embryo. Development. 1999;126:3735–3745. - PubMed
-
- Le Guyader D, Redd MJ, Colucci-Guyon E, Murayama E, Kissa K, et al. Origins and unconventional behavior of neutrophils in developing zebrafish. Blood. 2008;111:132–141. - PubMed
-
- Robertsen B. The interferon system of teleost fish. Fish Shellfish Immunol. 2006;20:172–191. - PubMed
Publication types
MeSH terms
LinkOut - more resources
Full Text Sources
Molecular Biology Databases
