. 2011 Feb 3;6(2):e16700.
doi: 10.1371/journal.pone.0016700.

Anti-leukemia activity of in vitro-expanded human gamma delta T cells in a xenogeneic Ph+ leukemia model

Affiliations

Anti-leukemia activity of in vitro-expanded human gamma delta T cells in a xenogeneic Ph+ leukemia model

Gabrielle M Siegers et al. PLoS One. .

Abstract

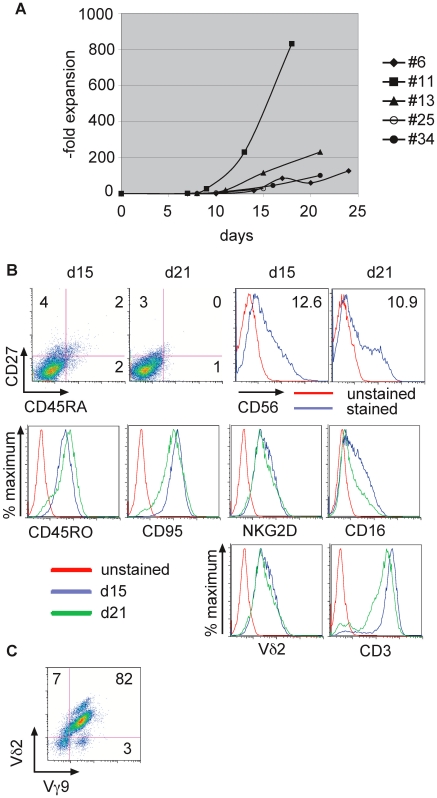
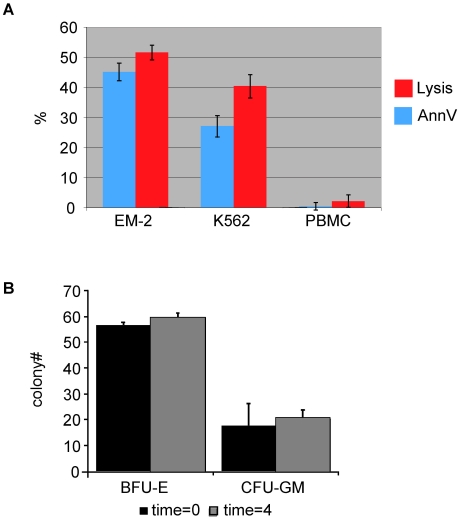
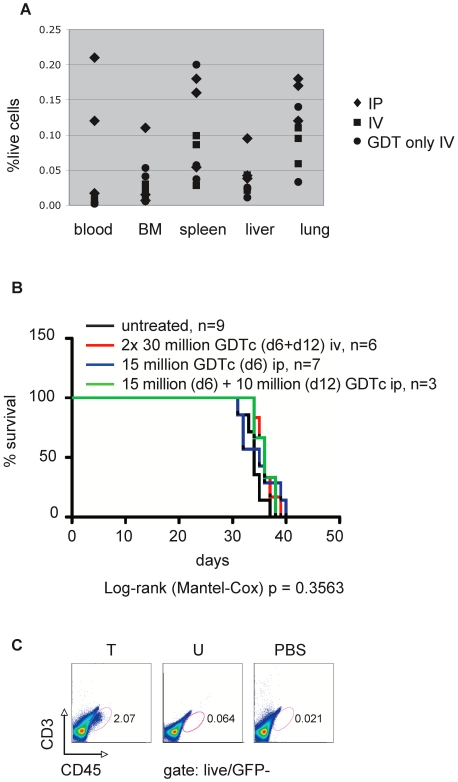
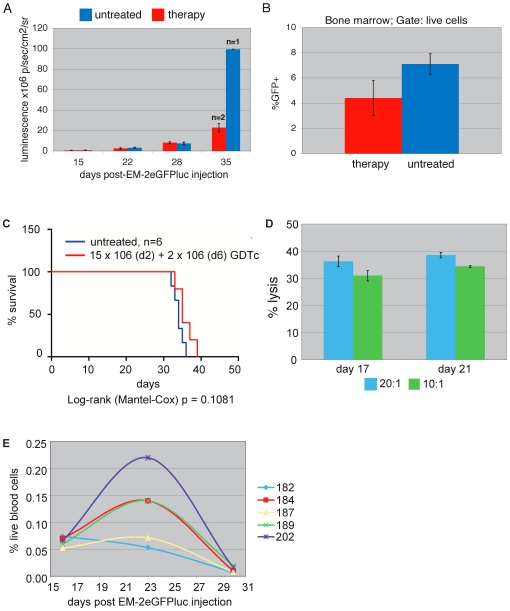
Gamma delta T cells (GDTc) lyse a variety of hematological and solid tumour cells in vitro and in vivo, and are thus promising candidates for cellular immunotherapy. We have developed a protocol to expand human GDTc in vitro, yielding highly cytotoxic Vgamma9/Vdelta2 CD27/CD45RA double negative effector memory cells. These cells express CD16, CD45RO, CD56, CD95 and NKG2D. Flow cytometric, clonogenic, and chromium release assays confirmed their specific cytotoxicity against Ph(+) cell lines in vitro. We have generated a fluorescent and bioluminescent Ph(+) cell line, EM-2eGFPluc, and established a novel xenogeneic leukemia model. Intravenous injection of EM-2eGFPluc into NOD.Cg-Prkdcscid Il2rgtm1Wjl/SzJ (NSG) mice resulted in significant dose-dependent bone marrow engraftment; lower levels engrafted in blood, lung, liver and spleen. In vitro-expanded human GDTc injected intraperitoneally were found at higher levels in blood and organs compared to those injected intravenously; GDTc survived at least 33 days post-injection. In therapy experiments, we documented decreased bone marrow leukemia burden in mice treated with GDTc. Live GDTc were found in spleen and bone marrow at endpoint, suggesting the potential usefulness of this therapy.


Conflict of interest statement

Competing Interests: The authors have declared that no competing interests exist.

Figures

Figure 1
Figure 1. Human Vgamma9 Vdelta2 gamma delta T cells expanded in vitro have an effector memory phenotype.
a) Fold expansion data for gamma delta T cell cultures derived from a single donor exhibit variable yet high yields. The isolation number (#6, #11, #13, #25, #34) is indicated; cultures shown were derived from the same donor at different times, a minimum of 2 months apart. b) Expanded cells from culture #25 were harvested on days 15 and 21, then stained for the indicated surface markers and subject to flow cytometry. % live cells which stained for CD27 and/or CD45RA are shown on the dot plots. Histogram overlays show the indicated marker expression as % maximum. CD56 expression is displayed for stained and unstained cells on days 15 and 21 as indicated above the respective panels; –fold mean fluorescence intensity over the unstained control is indicated. Histogram overlays show expression of markers CD45RO, CD95, NKG2D, CD16, Vdelta2 TCR and CD3 on day 15 (blue) and day 21 (green), with an unstained sample serving as negative control (red). Shown is a representative example; (n = 8, 2 different donors). c) A representative flow cytometric analysis of expanded gamma delta T cells indicates that Vdelta2 is paired with Vgamma9 (n = 3 different donors). Cells were harvested and stained with anti-Vgamma9 biotin antibody, followed by anti-streptavidin-APC and anti-Vdelta2PE antibodies.
Figure 2
Figure 2. Expanded gamma delta T cells are selectively cytotoxic against Ph+ leukemia cells and not autologous hematopoietic progenitors.
a) Gamma delta T cells are selectively cytotoxic against Ph+ leukemia cell lines K562 and EM-2, but not against normal autologous hematopoietic progenitors, as assessed by a flow cytometric cytotoxicity assay (n = 9 different donors, minimum 6 replicates/donor). Gamma delta T cells were incubated with target cells for 4 hours at an effector:target ratio of 20∶1. Mean % AnnexinV and %lysis ± standard error of target cells is shown. Data were acquired via FACSCalibur and analysed with CellQuest™ software. b) Co-culture of gamma delta T cells with PBMCs does not adversely affect PBMC growth. 200,000 gamma delta T cells were co-incubated with 10,000 autolougous PBMC at 20∶1 effector:target ratio for 0 or 4 hours as indicated. Subsequently, gamma delta T cells were depleted and of the remaining cells, 150,000 per plate were seeded in triplicate for colony-forming assays for normal hematopoietic progenitors, BFU-E and CFU-GM (n = 3 different donors in triplicate).
Figure 3
Figure 3. EM-2eGFPluc cells are fluorescent and bioluminescent.
a) Scheme of the recombinant lentivector constructed for these studies showing the dual promoter system driving eGFP and Luciferase expression in transduced cells. b) The parental cell line, EM-2, and transduced line, EM-2eGFPluc, were subject to flow cytometry. Shown is a representative example. Cells were assessed by flow cytometry prior to each injection into NSG mice (n = 9). c) EM2eGFPluc cell bioluminescence directly correlates with cell number. Cells were harvested and density adjusted in PBS, then subject to serial dilution 1∶2 from well to well. After addition of luciferin, cells were imaged using IVIS® technology and then quantified using Living Image™ software. Luminescence was plotted against cell number and linear regression calculated using Microsoft Excel software (n = 2).
Figure 4
Figure 4. EM-2eGFPluc engraft the bone marrow in a novel in vivo xenogeneic Ph+ leukemia model.
a) NSG mice were injected with EM-2eGFPluc iv on day 0. On day 21, mice were injected with luciferin, anesthetized and imaged using IVIS® technology. Shown here are three mice that received 2.5×10⁵ and two mice that were injected with 1×10⁵ EM-2eGFPluc on day 0. In total, 17 mice were used in this experiment: 3 per group at doses of 1, 2.5, 5, 7.5 and 10×105 EM-2eGFPluc; 1 mouse was injected with 0.4×10⁵ EM-2eGFPluc; 1 mouse was injected with PBS +0.2% BSA alone. b) On day 28, mice were injected with luciferin, anesthetized and imaged using IVIS® technology. Bioluminescence was quantified using Living Image™ software and bone marrow flux per mouse plotted against injected EM-2eGFPluc. Shown here are the results from the 5 groups of 3 mice described in Fig. 4a. Bone marrow (BM) flux units are photons/second/square centimeters/steradian.
Figure 5
Figure 5. Higher gamma delta T cell levels result when they are injected intraperitoneally versus intravenously.
a) Irradiated NSG mice were injected with 0 (n = 3 mice GDT only iv) or 1.5 million EM-2eGFPluc (n = 6 mice) on day 0. On day 6, 3 mice were injected with 30 million Donor 2 GDTc intraperitoneally (IP); 6 mice were injected iv (IV+GDTonlyIV). Donor 2 GDTc had been cultured for 20 days prior to injection. Mice were sacrificed on day 20, the indicated tissues were prepared for flow cytometric assessment. Gamma delta T cells were stained with anti-CD3 APC and anti-CD45 PE antibodies. b) 1.5 million EM-2eGFPluc cells were injected intravenously into irradiated NSG mice (n = 25). 30 million Donor 1 GDTc (Isolation 13, days 15 and 21) were injected iv on days 6 and 12 post-leukemia cell injection, along with 100 IU recombinant human IL-2/mouse, plus one additional IL-2 dose on day 21 (n = 6, red line). 15 million GDTc (Isolation 25, day 15) were administered ip on day 6 (n = 10, blue and green lines); a second dose of 10 million (Isolation 25, day 21) was given on day 12 (n = 3, green line). IL-2 was administered on GDTc injection days only (green and blue). Survival curves were not significantly different (Log-rank/Mantel-Cox p = 0.3563). c) Bone marrow from treated (T), untreated (U) and PBS control mice was extracted and stained with anti-CD3APC and anti-CD45PE antibodies and then subject to flow cytometric analysis. A live cell gate was made based on forward and side scatter properties; the GFP-negative population of live cells is shown here. This is a representative example of bone marrow samples taken at endpoint from the experiment described in b (T single dose, blue line; U, black line). Bone marrow samples were obtained from 2 PBS controls, 1 untreated and 7 treated mice in total.
Figure 6
Figure 6. Gamma delta T cell therapy lowers bone marrow leukemia burden.
a) 1 million EM-2eGFPluc cells were injected intravenously into NSG mice (n = 11). 15 million Donor 1 GDTc were injected intraperitoneally on day 2 and 2 million on day 6 post-leukemia cell injection (n = 5). All mice received 100 IU recombinant human IL-2 intraperitoneally on gamma delta T cell injection days and then weekly thereafter. IVIS® imaging was performed on the indicated days and bone marrow bioluminescence was quantified using Living Image™ software. Untreated (blue) n = 6 and therapy (red) n = 5, except on day 35, where untreated n = 1 and treated n = 2, since most mice were sacrificed between days 28 and 35. Shown are mean luminescence ± standard error. b) At experimental endpoint, bone marrow was extracted and GFP positive cells detected by flow cytometry. Results from therapy mice are shown in red and untreated in blue (error bars represent standard error; n = 5 and 5, respectively). c) Kaplan Meier survival curve for the experiment described in a) and b), with no significant survival advantage achieved (untreated blue line (n = 6) treated red (n = 5); Log-rank/Mantel-Cox, p = 0.1081). d) Donor 1 gamma delta T cells were tested in Cr51 release assays against EM-2eGFPluc targets on injection days for the experiment shown in a)-c). Effectors and Cr51-labeled targets were incubated at 20∶1 (blue) and 10∶1 (red) for 4 hours at 37°C and Cr51 release measured (n = 1 donor in triplicate). Shown is the mean ± standard deviation. These results are representative for gamma delta T cell cytotoxicity measured on injection days in other therapy experiments (n = 4 independent experiments in tripicate, 2 different donors). e) For the experiment shown in a)-d), weekly blood samples were taken via saphenous vein and blood was stained with anti-human CD3 and anti-human CD45 antibodies to detect gamma delta T cells on the indicated days. Gating was done on the live cell population in forward and side scatter. Individual treated mice are indicated by number (n = 5 treated mice in this experiment). Monitoring of gamma delta T cells in blood was performed in every therapy experiment described (n = 4 independent in vivo experiments).

Similar articles

Cited by

References

    1. Lamb LS, Jr, Lopez RD. gammadelta T cells: a new frontier for immunotherapy? Biol Blood Marrow Transplant. 2005;11:161–168. - PubMed
    1. Ensslin AS, Formby B. Comparison of cytolytic and proliferative activities of human gamma delta and alpha beta T cells from peripheral blood against various human tumor cell lines. J Natl Cancer Inst. 1991;83:1564–1569. - PubMed
    1. Zheng BJ, Chan KW, Im S, Chua D, Sham JS, et al. Anti-tumor effects of human peripheral gammadelta T cells in a mouse tumor model. Int J Cancer. 2001;92:421–425. - PubMed
    1. Kabelitz D, Wesch D, He W. Perspectives of gammadelta T cells in tumor immunology. Cancer Res. 2007;67:5–8. - PubMed
    1. Viey E, Lucas C, Romagne F, Escudier B, Chouaib S, et al. Chemokine receptors expression and migration potential of tumor-infiltrating and peripheral-expanded Vgamma9Vdelta2 T cells from renal cell carcinoma patients. J Immunother. 2008;31:313–323. - PubMed

Publication types

MeSH terms

Substances