

Structural properties of the Caenorhabditis elegans neuronal network
- PMID: 21304930
- PMCID: PMC3033362
- DOI: 10.1371/journal.pcbi.1001066
Structural properties of the Caenorhabditis elegans neuronal network
Abstract
Despite recent interest in reconstructing neuronal networks, complete wiring diagrams on the level of individual synapses remain scarce and the insights into function they can provide remain unclear. Even for Caenorhabditis elegans, whose neuronal network is relatively small and stereotypical from animal to animal, published wiring diagrams are neither accurate nor complete and self-consistent. Using materials from White et al. and new electron micrographs we assemble whole, self-consistent gap junction and chemical synapse networks of hermaphrodite C. elegans. We propose a method to visualize the wiring diagram, which reflects network signal flow. We calculate statistical and topological properties of the network, such as degree distributions, synaptic multiplicities, and small-world properties, that help in understanding network signal propagation. We identify neurons that may play central roles in information processing, and network motifs that could serve as functional modules of the network. We explore propagation of neuronal activity in response to sensory or artificial stimulation using linear systems theory and find several activity patterns that could serve as substrates of previously described behaviors. Finally, we analyze the interaction between the gap junction and the chemical synapse networks. Since several statistical properties of the C. elegans network, such as multiplicity and motif distributions are similar to those found in mammalian neocortex, they likely point to general principles of neuronal networks. The wiring diagram reported here can help in understanding the mechanistic basis of behavior by generating predictions about future experiments involving genetic perturbations, laser ablations, or monitoring propagation of neuronal activity in response to stimulation.
Conflict of interest statement
The authors have declared that no competing interests exist.
Figures
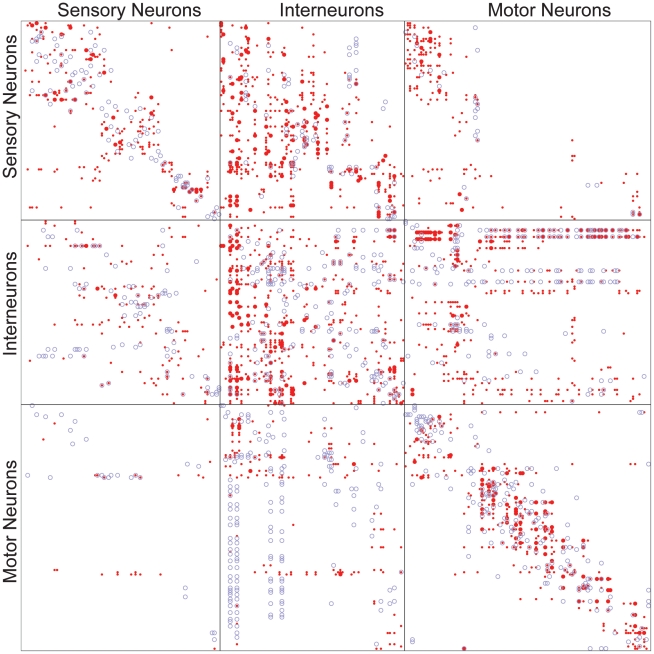
 synaptic contacts, whereas large points indicate
  or more synaptic contacts. All gap junction connections are depicted in the same way, irrespective of number of gap junction contacts.
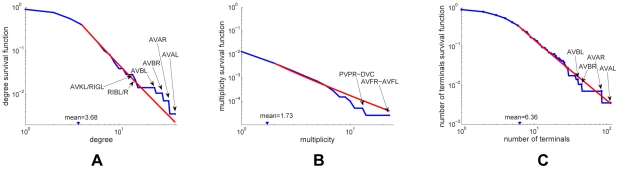
 for the degrees (a);
  for the multiplicity distribution (b);
  for the number of synaptic terminals (c). The exponents for the power law fits of the corresponding survival functions are obtained by subtracting one.
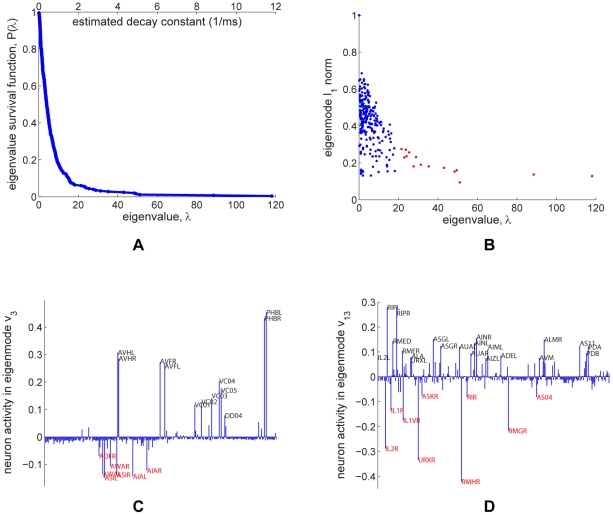
 , is
, is  and the spectral radius,
  , is
, is  . A time scale associated with the decay constant is also given. (b). Scatterplot showing the
  norm and decay constant of the eigenmodes of the Laplacian. The fastest modes from Figure 3 in Text S4 are marked in red. The sparsest and slowest modes, most amenable to biological analysis, are located in the lower-left corner of the diagram. (c). Eigenmode of Laplacian corresponding to
  (marked green in panel (b)). (d). Eigenmode of Laplacian corresponding to
  (marked cyan in panel (b)).
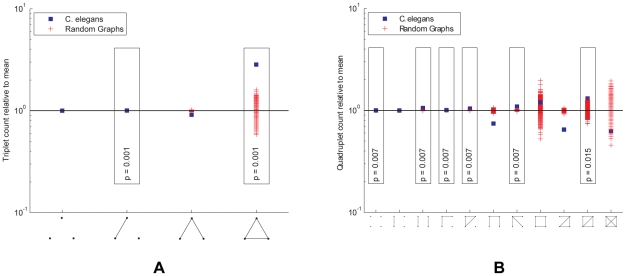
 -value from the step-down min-P-based algorithm for multiple-hypothesis correction , (
 ) shown inside. (a). The ratio of the
  -subnetwork distribution and for the mean of a degree-preserving ensemble of random networks (
 ). The counts for the particular random networks that appeared in the ensemble are also shown. (b). The ratio of the
  -subnetwork distribution and for the mean of a degree and triangle-preserving ensemble of random networks (
 ). The counts for the particular random networks that appeared in the ensemble are also shown.
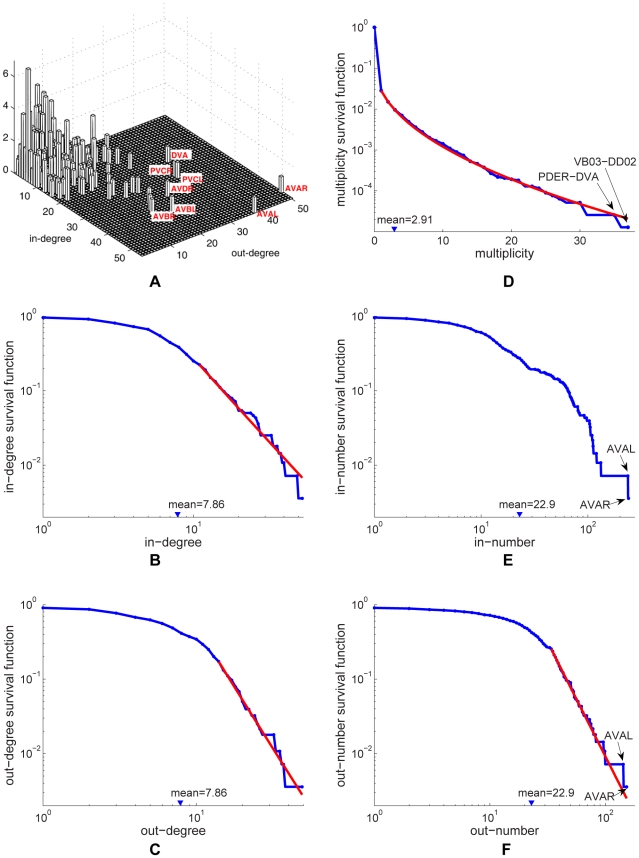
 for in-degree (b);
  for out-degree (c); and
  for out-number (f). The exponents for the survival function fits can be obtained by subtracting one. The survival function of the multiplicity distribution for
  can be fit by a stretched exponential of the form
  where
where  and
and  (d). No satisfactory fit was found for the distribution of in-numbers (e).
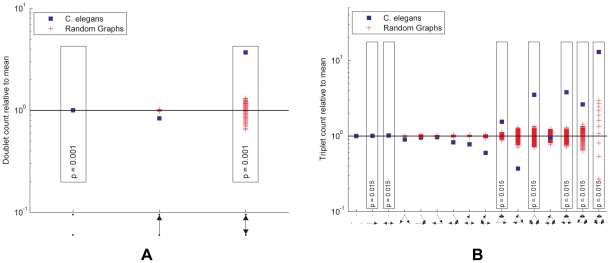
 -value from the step-down min-P-based algorithm for multiple-hypothesis correction , (
 ) shown inside. (a). The ratio of the
  -subnetwork distribution and the mean of a random network ensemble (
 ). Realizations of the random network ensemble are also shown. (b). The ratio of the
  -subnetwork distribution and the mean of a random network ensemble (
 ). Realizations of the random network ensemble are also shown.
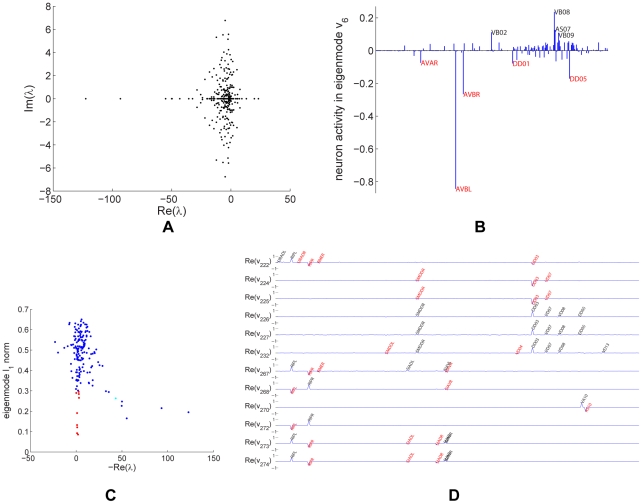
 (marked cyan in panel (c)). (c). Scatterplot showing the sparseness and decay constant of the eigenmodes. (d). Sparse and slow eigenmodes of the combined network (marked red in panel (c)). The real parts of the eigenmodes corresponding to
  , and
, and  are shown. The eigenmodes are labeled with neurons that take value above a fixed absolute value threshold. Neurons with negative values are in red, whereas neurons with positive values are in black.
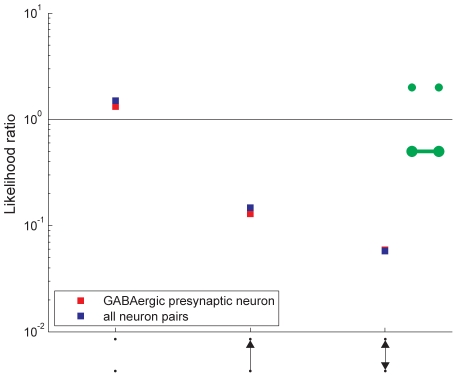
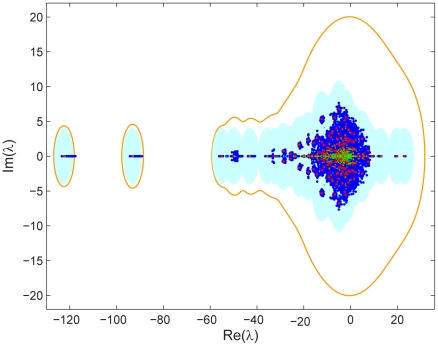
 is used (the average spectral norm of the
  editing matrices was
  ). The spectrum of the giant component of the combined network matrix
  under an alternate quantitation of send_joint synapses is also shown (green).
References
-
- Adams MD, Celniker SE, Holt RA, Evans CA, Gocayne JD, et al. The genome sequence of Drosophila melanogaster. Science. 2000;287:2185–2195. doi: 10.1126/science.287.5461.2185. - DOI - PubMed
-
- Lander ES, Linton LM, Birren B, Nusbaum C, Zody MC, et al. Initial sequencing and analysis of the human genome. Nature. 2001;409:860–921. - PubMed
-
- Briggman KL, Denk W. Towards neural circuit reconstruction with volume electron microscopy techniques. Curr Opin Neurobiol. 2006;16:562–570. doi: 10.1016/j.conb.2006.08.010. - DOI - PubMed
-
- Smith SJ. Circuit reconstruction tools today. Curr Opin Neurobiol. 2007;17:601–608. doi: 10.1016/j.conb.2007.11.004. - DOI - PMC - PubMed
-
- Lichtman JW, Livet J, Sanes JR. A technicolour approach to the connectome. Nat Rev Neurosci. 2008;9:417–422. doi: 10.1038/nrn2391. - DOI - PMC - PubMed
Publication types
MeSH terms
Grants and funding
LinkOut - more resources
Full Text Sources
Other Literature Sources
Miscellaneous
