. 2011 Feb 3;7(2):e1001074.
doi: 10.1371/journal.pcbi.1001074.

Accurate quantification of functional analogy among close homologs

Affiliations

Accurate quantification of functional analogy among close homologs

Maria D Chikina et al. PLoS Comput Biol. .

Abstract

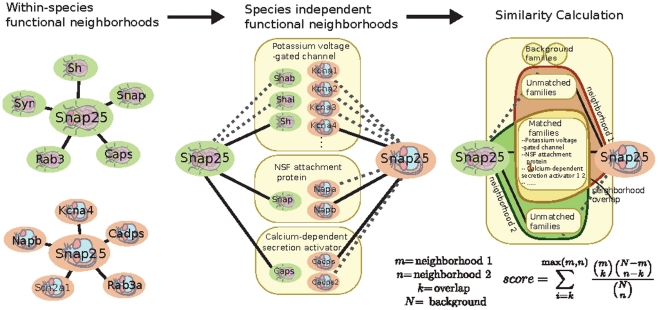
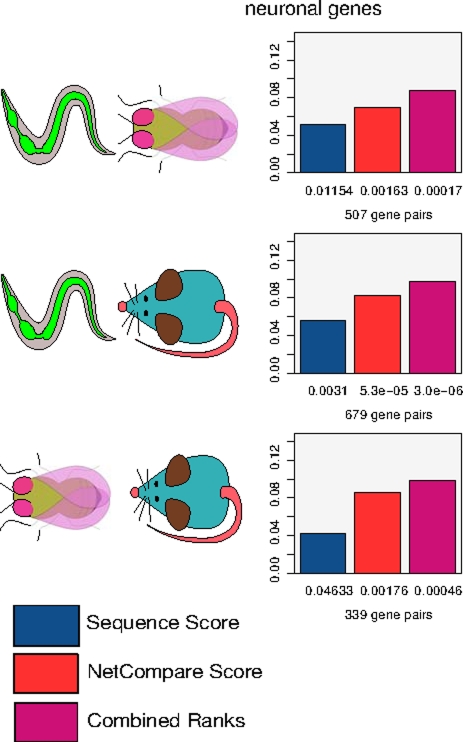
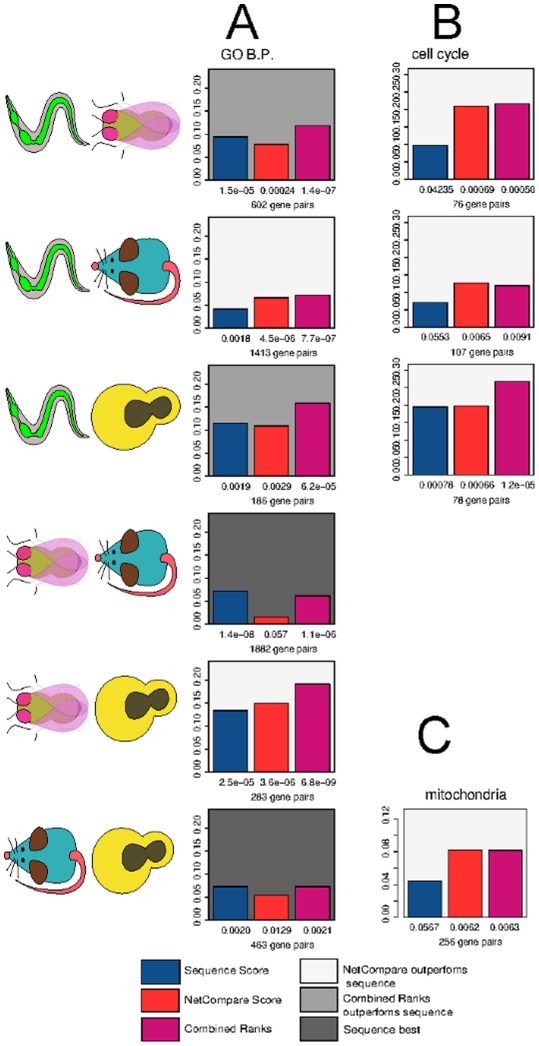
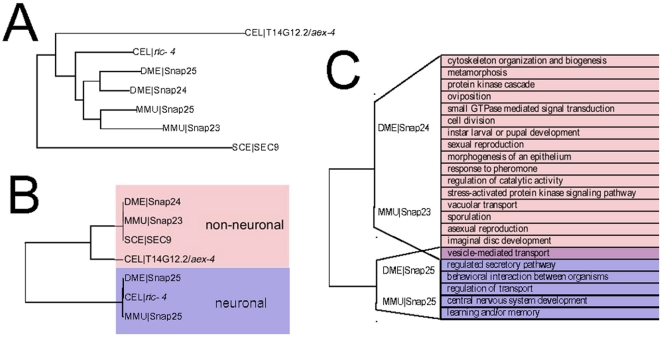
Correctly evaluating functional similarities among homologous proteins is necessary for accurate transfer of experimental knowledge from one organism to another, and is of particular importance for the development of animal models of human disease. While the fact that sequence similarity implies functional similarity is a fundamental paradigm of molecular biology, sequence comparison does not directly assess the extent to which two proteins participate in the same biological processes, and has limited utility for analyzing families with several parologous members. Nevertheless, we show that it is possible to provide a cross-organism functional similarity measure in an unbiased way through the exclusive use of high-throughput gene-expression data. Our methodology is based on probabilistic cross-species mapping of functionally analogous proteins based on Bayesian integrative analysis of gene expression compendia. We demonstrate that even among closely related genes, our method is able to predict functionally analogous homolog pairs better than relying on sequence comparison alone. We also demonstrate that the landscape of functional similarity is often complex and that definitive "functional orthologs" do not always exist. Even in these cases, our method and the online interface we provide are designed to allow detailed exploration of sources of inferred functional similarity that can be evaluated by the user.


Conflict of interest statement

The authors have declared that no competing interests exist.

Figures

Figure 1
Figure 1. Overview of the functional similarity calculation method.
Species-specific functional networks are derived by Bayesian integration of microarray data. For each intra-species pair of genes, the networks associate a probability of functional relationship based on their pattern of correlation. For a single gene, the set of genes with high probabilities of being functionally related to it defines a functional neighborhood. To make functional neighborhoods comparable across organisms, neighbors are grouped into meta-genes according to their Treefam families. The network similarity score is then defined as the hypergeometric probability of the overlap obtained from intersecting the sets of species-independent Treefam families present in each species-specific functional neighborhood. Such intersection analysis enables identification of specific biological processes responsible for network similarity scores. We have taken a comparison between the mouse and fly Snap25 genes as the basis for the schematic figure. The overlap meta-genes are a selection and the complete overlap can be viewed online using our webserver.
Figure 2
Figure 2. Network similarity score correctly identifies homologs with shared expression in the nervous system.
We consider single query genes that are known to express in the nervous system and have multiple homologs in another organism (according to Treefam family co-membership), with at least one of the homologs also expressed in the nervous system (“correct” functional homolog), and another whose expression has been evaluated but was not detected in the nervous system (“incorrect” functional homolog in this evaluation). We then evaluate how well the various metrics rank the homologs consistent with their nervous system expression by computing the AUCs of homolog rankings (normalized per query gene). Numbers below the bars represent the p-value that corresponds to the AUC score.
Figure 3
Figure 3. Network similarity score effectively identifies homologs involved in the same biological process and is often complementary to sequence-based information.
This evaluation is performed identically to the nervous system evaluation with the variation that “correct” functional homologs are those that are co-annotated with the query to a specific GO term while “incorrect” ones are those that are annotated to a specific term but do not share annotations with the query. Numbers below the bars represent the p-value that corresponds to the AUC score. A. Evaluation performed with all of specific biological process annotations with experimental evidence codes. B. Evaluations performed by considering co-annotation to “cell cycle” only. C. Evaluations performed with co-annotation to “mitochondria”.
Figure 4
Figure 4. Convergent evolution in Snap25 family.
A. The sequence derived family tree (TreeFam) indicates the presence of 2 lineage specific duplications so that the fly and mouse family members are collectively coorthologous. B. Using our method we have clustered members of the Snap25 family with respect to functional similarity. Family members cluster into neuronal and non-neuronal functional groups in a manner that is independent of their evolutionary history. Though the mouse and Drosophila Snap25 members have arisen independently by lineage specific duplications the expression of the two duplicates follow similar patterns with one homolog having neuronal pattern of expression, while the other expression pattern is consistent with participating in general exocytosis. C. Neighborhood GO enrichment for the four coorthologous genes. Functions shown are enriched in the neighborhood of either 2 or 4 (as in the case of “vesicle-mediated transport”) genes. While all four genes have neighborhoods indicative of secretary function the Snap23/Snap24 and Snap25/Snap25 pairs associate with a number of distinct functions. This analysis thus makes the prediction of convergent functions that is supported by several lines of experimental evidence , , , , .
Figure 5
Figure 5. Functional similarity among members of the lamin family.
A. The sequence derived family tree (Treefam) for the lamin genes being considered. B. The patterns of functional similarity among members of the lamin family. Lamins can be broadly classified as type-A and type-B based on pattern of expression and structural features, with type-A lamin mutations causing a diverse set of human diseases. While C. elegans has only a single type-B gene, the Drosophila genome has two lamin genes, Lam and LamC, that confirm to type-A and type-B patterns respectively, though they arose independently from their vertebrate counterparts. Using the network similarity score, we demonstrate that canonical invertebrate type-B lamins show significant similarity with mammalian type-A lamins and thus may be important in modeling human laminopathies.
Figure 6
Figure 6. Using neighborhood overlaps between members of the cytosolic superoxide dismutase family to identify sources of functional ortholog similarity.
A Venn diagram of shared meta-gene neighbors is shown. While both C. elegans genes have neighborhoods that overlap with SOD1, the overlap regions are distinct and have different functional enrichments that are consistent with the specialized functions of these genes.

References

    1. Bandyopadhyay S, Sharan R, Ideker T. Systematic identification of functional orthologs based on protein network comparison. Genome Res. 2006;16:428–435. - PMC - PubMed
    1. Li H, Coghlan A, Ruan J, Coin LJ, Hériché J-K, et al. TreeFam: a curated database of phylogenetic trees of animal gene families. Nucleic Acids Res. 2006;34:D572–D580. - PMC - PubMed
    1. Singh R, Xu J, Berger B. Global alignment of multiple protein interaction networks with application to functional orthology detection. Proc Natl Acad Sci U S A. 2008;105:12763–12768. - PMC - PubMed
    1. Zaslavskiy M, Bach F, Vert J-P. Global alignment of protein-protein interaction networks by graph matching methods. Bioinformatics. 2009;25:i259–i267. - PMC - PubMed
    1. Myers CL, Robson D, Wible A, Hibbs MA, Chiriac C, et al. Discovery of biological networks from diverse functional genomic data. Genome Biol. 2005;6:R114. - PMC - PubMed

Publication types

MeSH terms

LinkOut - more resources