

doi: 10.1371/journal.pcbi.1001065.
Digital atlasing and standardization in the mouse brain
Affiliations
- PMID: 21304938
- PMCID: PMC3033370
- DOI: 10.1371/journal.pcbi.1001065
Item in Clipboard
Digital atlasing and standardization in the mouse brain
PLoS Comput Biol.
.
Erratum in
- PLoS Comput Biol. 2011 Feb;7(2). doi: 10.1371/annotation/22c5808a-56cf-46e5-ba1b-456e838a5428. Larsen, Stephen D [corrected to Larson, Stephen D] doi: 10.1371/annotation/22c5808a-56cf-46e5-ba1b-456e838a5428
No abstract available
Conflict of interest statement
The authors have declared that no competing interests exist.
Figures
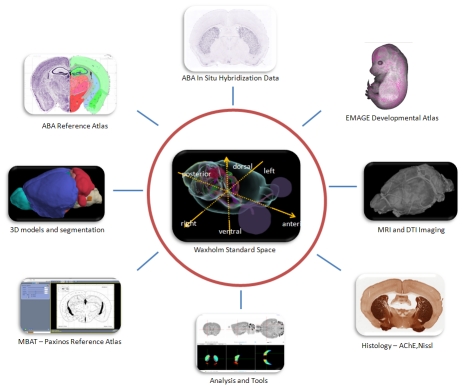
The Waxholm Space (WHS) atlas acts as the hub of an infrastructure connecting data and key reference spaces. Reference atlases that have been mapped to this space are “standardized” and can be used to share their associated data and services in a manner that is meaningful to external users. Clockwise from upper left, resources may include neuroanatomic reference atlases, large-scale gene expression databases, developmental databases, MRI and DTI imaging, histological data, analysis tools, online applications, and other 3-D anatomic models.
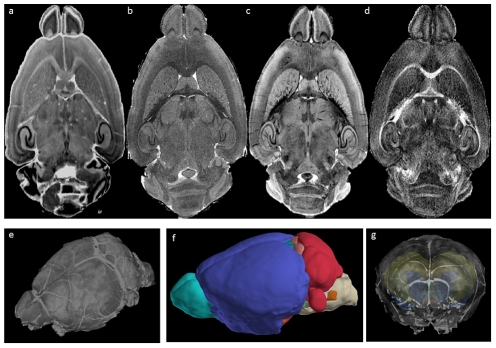
Isotropic 21.5-µm3 resolution MR volumes were generated along with a complete 21-µm Nissl series of the same brain. The WHS origin is defined by the junction of the rostral and dorsal tangential planes of the anterior commissure with the mid-sagittal plane. (a) Nissl histology, (b) T1 image, (c) T2*, this image is used to provide the Nissl-MRI registration (d) fractional anisotropy image, essentially showing white matter. Several cytoarchitectonic domains can be identified at this resolution, including individual cortical layers within allocortex and isocortex, caudate putamen, and the hippocampal commisure. (e) volumetric rendering of T2* image, (f) smoothed rendering of 37 manually delimited structures, (g) 3-D rendering of WHS with gene expression correlation projection from hippocampus. Image credits: (a–d) Center for In Vivo Microscopy, Box 3302, Duke University Medical Center, Durham, North Carolina, United States of America; (e–g) Allen Institute for Brain Science, Seattle, Washington, United States of America.
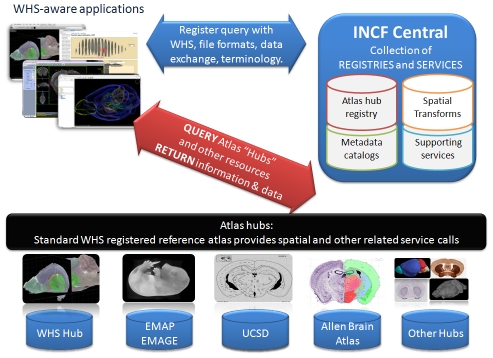
Individual scientific software applications will register with INCF Central for identification of file formats, transformations, standard query formats, and other essential metadata. After becoming WHS aware, key atlas hubs provide an entry point and connectivity into the community of atlases and available data resources. Presently, the Edinburgh Mouse Atlas Project (EMAP), the Whole Brain Catalog (UCSD), and the Allen Brain Atlas (ABA) have each been registered with the WHS infrastructure and can therefore initiate queries interchangeably. Other hubs can be similarly integrated and interest and resources permit.
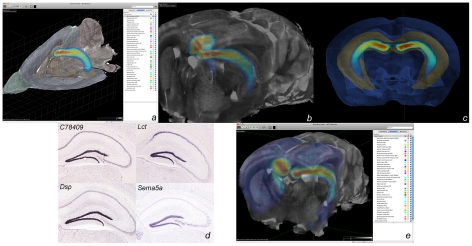
(a) WHS T1 MR image sliced on orthogonal planes. Color overlay on the planes represents segmentation of WHS anatomic regions. Blue-orange-yellow overlay is an ABA gene expression correlation map (from Anatomic Gene Expression Atlas [AGEA] online application, http://mouse.brain-map.org/agea ) rendered by maximum intensity projection and showing voxels where gene expression is highly correlated with the selected point of interest (POI). This POI, in the dentate gyrus of the hippocampus, was chosen in WHS, the coordinates transformed to ABA space, the corresponding correlation volume requested from the ABA Web service. The returned volume was finally transformed back to WHS for visualization. (b) Correlation volume in (a) merged with a volume rendering of WHS cropped around the hippocampus. (c) Surface representations of hippocampus in yellow and cortex in blue show the AGEA gene expression-defined dentate gyrus in relation to an MR-defined hippocampus. (d) Top four highest correlated genes from the ABA corresponding to (c). (e) A higher resolution view of the same query within the Allen Institute Brain Explorer interface.
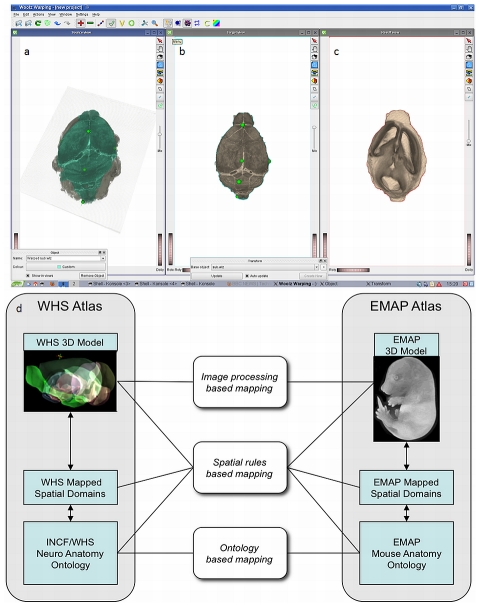
To link EMAP with WHS, the Waxholm volume was transformed into EMAP's native representation (b) and then mapped into EMAP Theiler Stage 23 (TS23) space, the result shown in (a). Similarly, the result of mapping the EMAP model into WHS is shown in (c). A few registration landmarks are shown in (a, b) to illustrate the process. The final transformation was established by anatomists who aligned recognizable tissue boundaries to within about five voxels in WWHS (∼100 microns). A prototype for an Edinburgh INCF hub allows access to EMAP and the related EMAGE gene expression databases available through the INCF-DAI (d). In addition to image processing–based mappings, alternative methods of mappings are being explored, including ontology-based mappings, and mapping of areas of interest across atlases using spatial rules (d).

From the WBC 3-DAtlas Integration Client shown in (a), a user can generate a spatial query of WHS registered atlases. A probe can be placed in the 3-D space of the viewer and WHS coordinates of the probe translated into other atlas coordinate spaces. Implemented queries include (b) CCDB-UCSD, (c) EMAP/EMAGE, and (d) AGEA/ABA, enabling a framework for interchange between these atlases.
Comment in
-
Building a megabrain atlas.Nat Methods. 2011 Apr;8(4):290. doi: 10.1038/nmeth0411-290. Nat Methods. 2011. PMID: 21574273 No abstract available.
References
-
- Paxinos G, Watson C. The rat brain in stereotaxic coordinates. Academic Press; 2007. p. 456 p. - PubMed
-
- Schmahmann JD, Doyon J, McDonald D, Holmes C, Lavoie K, et al. Three-dimensional MRI atlas of the human cerebellum in proportional stereotaxic space. Neuroimage. 1999;10:233–260. - PubMed
-
- Chakravarty MM, Bertrand G, Hodge CP, Sadikot AF, Collins DL. The creation of a brain atlas for image guided neurosurgery using serial histological data. Neuroimage. 2006;30:359–376. - PubMed
-
- Ganser KA, Dickhaus H, Metzner R, Wirtz CR. A deformable digital brain atlas system according to Talairach and Tournoux. Med Image Anal. 2004;8:3–22. - PubMed
MeSH terms
Grants and funding
LinkOut - more resources
Full Text Sources
Other Literature Sources
