. 2011 Feb 3;7(2):e1001290.
doi: 10.1371/journal.pgen.1001290.

Quantitative models of the mechanisms that control genome-wide patterns of transcription factor binding during early Drosophila development

Affiliations

Quantitative models of the mechanisms that control genome-wide patterns of transcription factor binding during early Drosophila development

Tommy Kaplan et al. PLoS Genet. .

Abstract

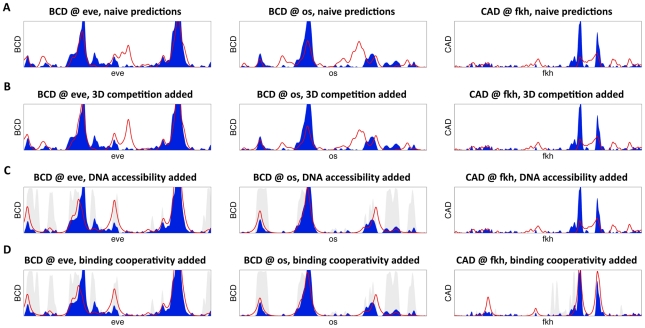
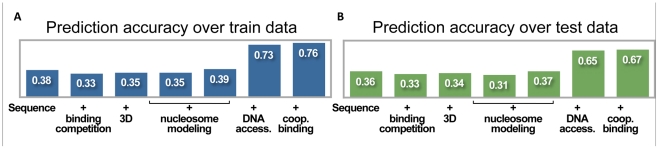
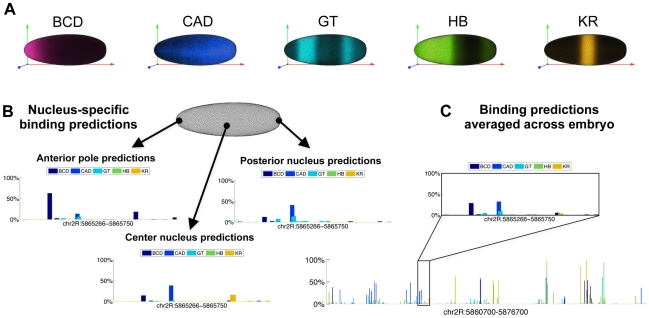
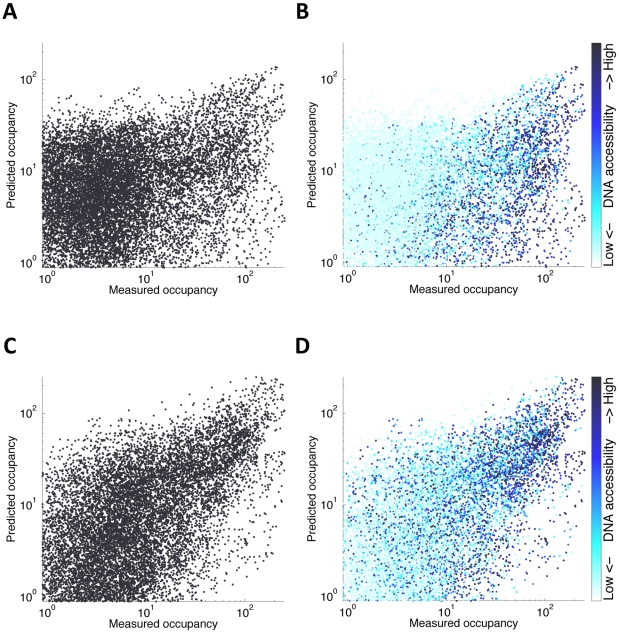
Transcription factors that drive complex patterns of gene expression during animal development bind to thousands of genomic regions, with quantitative differences in binding across bound regions mediating their activity. While we now have tools to characterize the DNA affinities of these proteins and to precisely measure their genome-wide distribution in vivo, our understanding of the forces that determine where, when, and to what extent they bind remains primitive. Here we use a thermodynamic model of transcription factor binding to evaluate the contribution of different biophysical forces to the binding of five regulators of early embryonic anterior-posterior patterning in Drosophila melanogaster. Predictions based on DNA sequence and in vitro protein-DNA affinities alone achieve a correlation of ∼0.4 with experimental measurements of in vivo binding. Incorporating cooperativity and competition among the five factors, and accounting for spatial patterning by modeling binding in every nucleus independently, had little effect on prediction accuracy. A major source of error was the prediction of binding events that do not occur in vivo, which we hypothesized reflected reduced accessibility of chromatin. To test this, we incorporated experimental measurements of genome-wide DNA accessibility into our model, effectively restricting predicted binding to regions of open chromatin. This dramatically improved our predictions to a correlation of 0.6-0.9 for various factors across known target genes. Finally, we used our model to quantify the roles of DNA sequence, accessibility, and binding competition and cooperativity. Our results show that, in regions of open chromatin, binding can be predicted almost exclusively by the sequence specificity of individual factors, with a minimal role for protein interactions. We suggest that a combination of experimentally determined chromatin accessibility data and simple computational models of transcription factor binding may be used to predict the binding landscape of any animal transcription factor with significant precision.


Conflict of interest statement

MBE is a co-founder and member of the Board of Directors of PLoS.

Figures

Figure 1
Figure 1. High-resolution predictions of protein-DNA binding landscape.
(A) The model's binding predictions (red line) are compared to in vivo binding landscape (solid blue). Shown are BCD binding at the 16 Kb eve locus (left), BCD binding at the 15 Kb os locus (middle), and CAD binding at the 24 Kb fkh locus (right). Here, the binding landscape was predicted independently for each transcription factor. (B) Same as (A), except allowing for direct binding competition between the five factors and with nucleosomes, and modeling binding independently in each of 6,078 nuclei of the fly embryo. (C) Same as (B), while incorporating non-uniform DNase I hypersensitivity-based prior on transcription factor binding to account for variations in DNA accessibility (shown in gray). (D) Same as (C), after adding cooperative interactions between adjacently bound factors in a thermodynamic setting.
Figure 2
Figure 2. Prediction accuracy at increasing degrees of model complexity.
(A) Accuracy of binding predictions at train set, including six known A-P targets and three control loci. Shown are the correlations between the model predictions and the in vivo binding landscape, at various degrees of model complexity. These include, from left to right: (1) independent predictions per transcription factor; (2) allowing binding competition between factors; (3) predictions at a single-nucleus resolution; (4) with sequence-specific model of nucleosome binding; (5) with sequence-independent model of nucleosome binding; (6) adding non-uniform prior on transcription factor binding using DNA accessibility measurements; and (7) adding cooperative binding interactions in a thermodynamic settings. (B) Same as (A), but for test set, including 15 known A-P targets and five control loci.
Figure 3
Figure 3. Predicting binding in single-nucleus resolution.
(A) Three-dimensional single-cell measurements of protein concentrations were used to estimate the concentration of the five transcription factors across the fly embryo. (B) To model binding competition while considering the differential concentration of factors, we modeled binding in each of the ∼6,000 nuclei of a fly embryo separately. Depicted are the probabilities of binding at the 485 bp-long eve stripe 2 CRM (chr2R:5,865,266-5,865,750) for the five factors, at three example nuclei: one at an the anterior pole, one towards the posterior end, and one at the center of the embryo. (C) Nucleus by nucleus predictions were averaged to predict the binding over the entire embryo. Shown are the predicted occupancies of the five factors along the entire 16 Kb eve locus (below), and along the stripe 2 CRM (inset).
Figure 4
Figure 4. Predictions with and without DNA accessibility prior.
(A) Measured (X-axis) vs. predicted (Y-axis) occupancy for all factors along all test loci. Predicted binding is based on a 3D cellular resolution mode, which allows for binding competition between factors and sequence-independent nucleosomes. (B) Same as (A), while coloring each genomic position based on to its DNA accessibility, ranging from pale cyan (lowly accessible) to dark blue (highly accessible). Almost all false binding predictions (dots above the diagonal) are lowly accessible in vivo. (C,D) Same as (A–B), but with DNase I hypersensitivity-based prior on transcription factor binding integrated into the model. This results with more accurate predictions, as measured by the correlation between measured and predicted occupancy, improving from 0.37 to 0.655.
Figure 5
Figure 5. Thermodynamic modeling of cooperative interactions.
(A) Cooperative parameters were used to represent the energy gain (or loss) for pairs of factors that bind in proximity (up to 95 bp apart). (B) Binding probabilities for the five factors at the eve stripe 1 locus (chr2R:5873439-5874240), as inferred by the generalized hidden Markov model. (C) Ensemble of configurations sampled from the probabilities in (B). Each row (of the 100 shown) corresponds to one configuration, marking the positions of bound sites. (D) Cooperative parameters for nearby pairs of occupied binding sites, as optimized over the training set.

References

    1. Walter J, Dever CA, Biggin MD. Two homeo domain proteins bind with similar specificity to a wide range of DNA sites in Drosophila embryos. Genes Dev. 1994;8:1678–1692. - PubMed
    1. Carr A, Biggin MD. A comparison of in vivo and in vitro DNA-binding specificities suggests a new model for homeoprotein DNA binding in Drosophila embryos. EMBO Journal. 1999;18:1598–1608. - PMC - PubMed
    1. Boyer LA, Lee TI, Cole MF, Johnstone SE, Levine SS, et al. Core transcriptional regulatory circuitry in human embryonic stem cells. Cell. 2005;122:947–956. - PMC - PubMed
    1. Bieda M, Xu X, Singer MA, Green R, Farnham PJ. Unbiased location analysis of E2F1-binding sites suggests a widespread role for E2F1 in the human genome. Genome Res. 2006;16:595–605. - PMC - PubMed
    1. Yang A, Zhu Z, Kapranov P, McKeon F, Church GM, et al. Relationships between p63 binding, DNA sequence, transcription activity, and biological function in human cells. Mol Cell. 2006;24:593–602. - PubMed

Publication types

MeSH terms

LinkOut - more resources