

Human mobility networks, travel restrictions, and the global spread of 2009 H1N1 pandemic
- PMID: 21304943
- PMCID: PMC3031602
- DOI: 10.1371/journal.pone.0016591
Human mobility networks, travel restrictions, and the global spread of 2009 H1N1 pandemic
Abstract
After the emergence of the H1N1 influenza in 2009, some countries responded with travel-related controls during the early stage of the outbreak in an attempt to contain or slow down its international spread. These controls along with self-imposed travel limitations contributed to a decline of about 40% in international air traffic to/from Mexico following the international alert. However, no containment was achieved by such restrictions and the virus was able to reach pandemic proportions in a short time. When gauging the value and efficacy of mobility and travel restrictions it is crucial to rely on epidemic models that integrate the wide range of features characterizing human mobility and the many options available to public health organizations for responding to a pandemic. Here we present a comprehensive computational and theoretical study of the role of travel restrictions in halting and delaying pandemics by using a model that explicitly integrates air travel and short-range mobility data with high-resolution demographic data across the world and that is validated by the accumulation of data from the 2009 H1N1 pandemic. We explore alternative scenarios for the 2009 H1N1 pandemic by assessing the potential impact of mobility restrictions that vary with respect to their magnitude and their position in the pandemic timeline. We provide a quantitative discussion of the delay obtained by different mobility restrictions and the likelihood of containing outbreaks of infectious diseases at their source, confirming the limited value and feasibility of international travel restrictions. These results are rationalized in the theoretical framework characterizing the invasion dynamics of the epidemics at the metapopulation level.
Conflict of interest statement
Figures
 and
and
 are
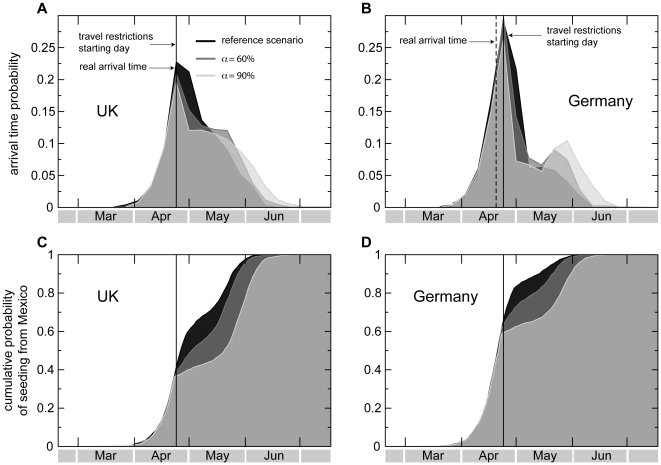
compared to the reference scenario where the observed drop in air travel
to/from Mexico is taken into account. A,B,
Probability distributions of the arrival time (defined as the date of
arrival of the first symptomatic case) in the United Kingdom
(A) and Germany (B) for different values
of
are
compared to the reference scenario where the observed drop in air travel
to/from Mexico is taken into account. A,B,
Probability distributions of the arrival time (defined as the date of
arrival of the first symptomatic case) in the United Kingdom
(A) and Germany (B) for different values
of  . Here we consider the importation from any
possible source country, not only Mexico. The vertical dotted line
indicates the observed arrival time in the country, as obtained from
official reports, and the vertical solid line indicates the starting
date of the travel restrictions, April 25, 2009, the day after the
international alert. The probability distributions are obtained from
2,000 stochastic realizations and data are binned over 7 days. Even when
imposing
. Here we consider the importation from any
possible source country, not only Mexico. The vertical dotted line
indicates the observed arrival time in the country, as obtained from
official reports, and the vertical solid line indicates the starting
date of the travel restrictions, April 25, 2009, the day after the
international alert. The probability distributions are obtained from
2,000 stochastic realizations and data are binned over 7 days. Even when
imposing  , the peak
of the probability distribution is not delayed with respect to the real
scenario. C,D, Cumulative probability
distributions of the first seeding event from Mexico to the United
Kingdom (C) and Germany (D) for different
values of
, the peak
of the probability distribution is not delayed with respect to the real
scenario. C,D, Cumulative probability
distributions of the first seeding event from Mexico to the United
Kingdom (C) and Germany (D) for different
values of  . Here we
consider any source of infection in the seeding event, including
symptomatic cases and non-detectable infected cases, such as latent and
asymptomatic, as allowed by the computational approach. The
distributions are computed over 2,000 stochastic realizations. The
effect of travel restrictions is very limited in delaying the time at
which the cumulative distribution reaches the unit.
. Here we
consider any source of infection in the seeding event, including
symptomatic cases and non-detectable infected cases, such as latent and
asymptomatic, as allowed by the computational approach. The
distributions are computed over 2,000 stochastic realizations. The
effect of travel restrictions is very limited in delaying the time at
which the cumulative distribution reaches the unit.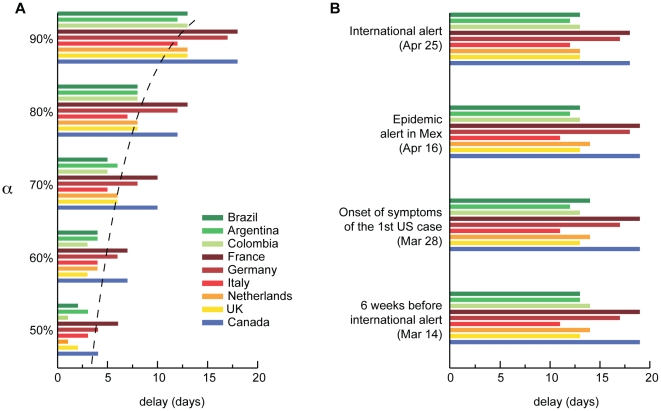
 . The delay
is measured in terms of the date at which the cumulative distribution of
the seeding from Mexico (see Figure 2) reaches 90%. The
dotted line shows the logarithmic behavior relating the delay as a
function of the imposed restrictions. The largest delay, gained when
imposing
. The delay
is measured in terms of the date at which the cumulative distribution of
the seeding from Mexico (see Figure 2) reaches 90%. The
dotted line shows the logarithmic behavior relating the delay as a
function of the imposed restrictions. The largest delay, gained when
imposing  , is less
than 20 days for all countries. The model also considers the
implementation of sanitary interventions in Mexico during the early
stage that was able to damp the exponential increase of cases in the
outbreak zone. Travel restrictions would therefore lead to a larger
impact during this phase due to the mitigating effect on the local
epidemic. If a country is seeded during this phase, the resulting delay
induced by the travel restrictions would be larger, thus creating the
observed differences in the resulting delays by country. B,
as in A, where earlier dates for the start of the
intervention are considered, has a fixed
, is less
than 20 days for all countries. The model also considers the
implementation of sanitary interventions in Mexico during the early
stage that was able to damp the exponential increase of cases in the
outbreak zone. Travel restrictions would therefore lead to a larger
impact during this phase due to the mitigating effect on the local
epidemic. If a country is seeded during this phase, the resulting delay
induced by the travel restrictions would be larger, thus creating the
observed differences in the resulting delays by country. B,
as in A, where earlier dates for the start of the
intervention are considered, has a fixed  : April 25,
corresponding to the day after the international alert; April 16,
corresponding to the epidemic alert in Mexico; March 28, corresponding
to the onset of symptoms of the first case in the US; and 6 weeks before
the international alert. In all these scenarios and for different
countries, the delay is always less than 20 days, highlighting that even
the enforcement of strong travel reduction as early as possible would
have had little effect.
: April 25,
corresponding to the day after the international alert; April 16,
corresponding to the epidemic alert in Mexico; March 28, corresponding
to the onset of symptoms of the first case in the US; and 6 weeks before
the international alert. In all these scenarios and for different
countries, the delay is always less than 20 days, highlighting that even
the enforcement of strong travel reduction as early as possible would
have had little effect.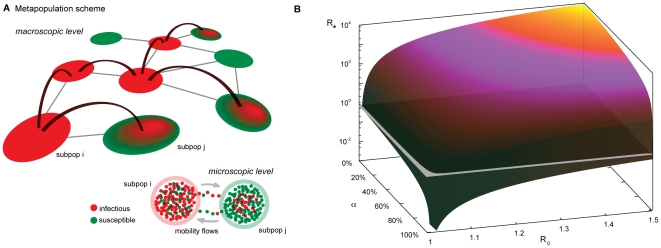
 , which is
the parameter representing the percentage of variation in the total
traffic
, which is
the parameter representing the percentage of variation in the total
traffic  in Eq.
(2). Only in the case of extremely low values of
R0 or extremely large values of
in Eq.
(2). Only in the case of extremely low values of
R0 or extremely large values of
 is it
possible to reduce R* below the
threshold.
is it
possible to reduce R* below the
threshold.References
-
- 2010 Influenza A(H1N1) - measures adopted by governments worldwide. http://iata.org.tr/whatwedo/safety_security/safety/health_safety/measure...
-
- Hollingsworth TD, Ferguson NM, Anderson RM. Will travel restrictions control the international spread of pandemic influenza? Nature Med. 2006;12:497–499. - PubMed
Publication types
MeSH terms
Grants and funding
LinkOut - more resources
Full Text Sources
Medical
