. 2011 Jan 31;6(1):e16523.
doi: 10.1371/journal.pone.0016523.

Mevalonate cascade regulation of airway mesenchymal cell autophagy and apoptosis: a dual role for p53

Affiliations

Mevalonate cascade regulation of airway mesenchymal cell autophagy and apoptosis: a dual role for p53

Saeid Ghavami et al. PLoS One. .

Abstract

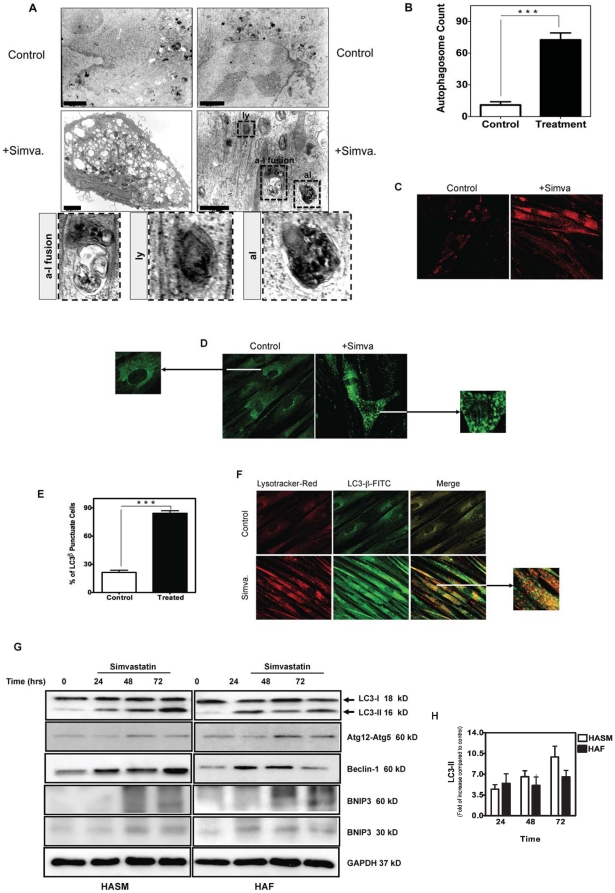
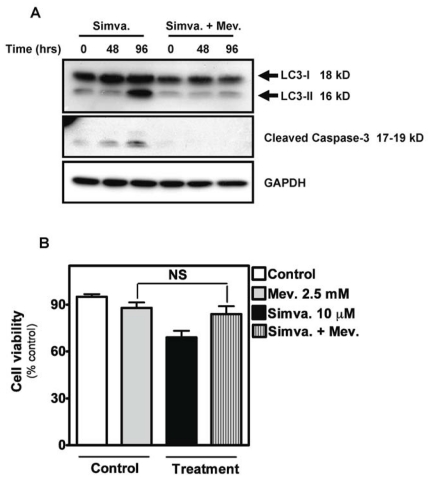
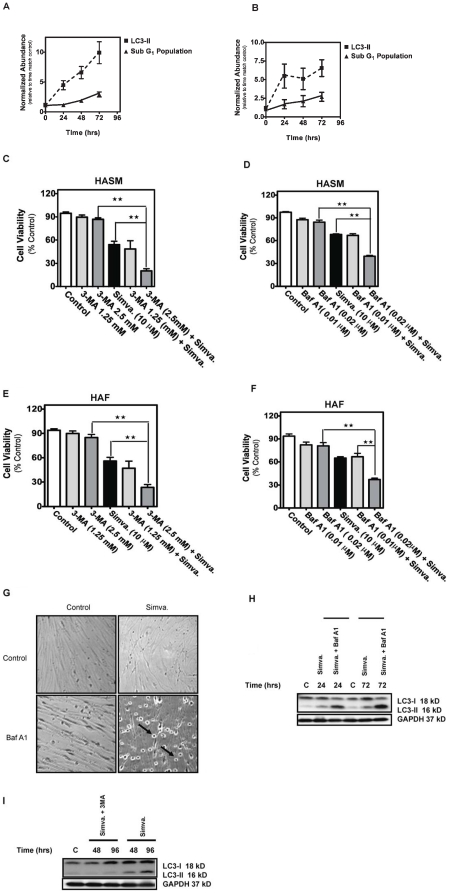
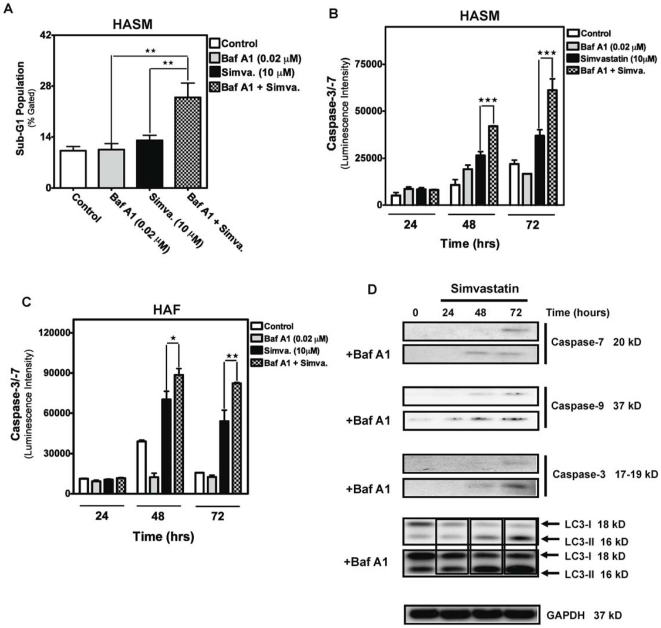
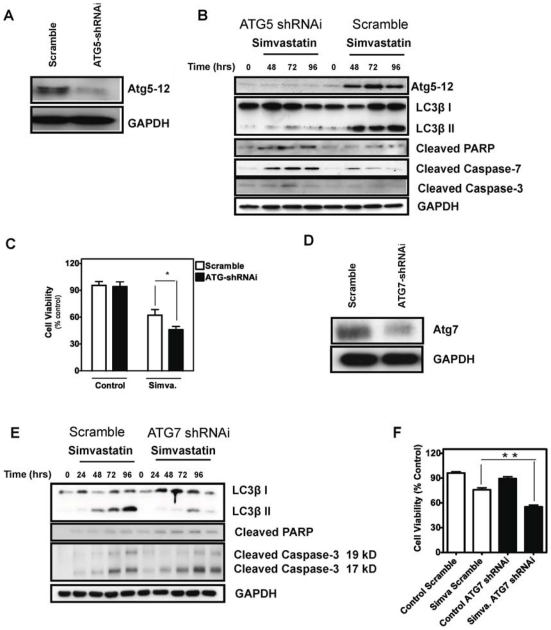
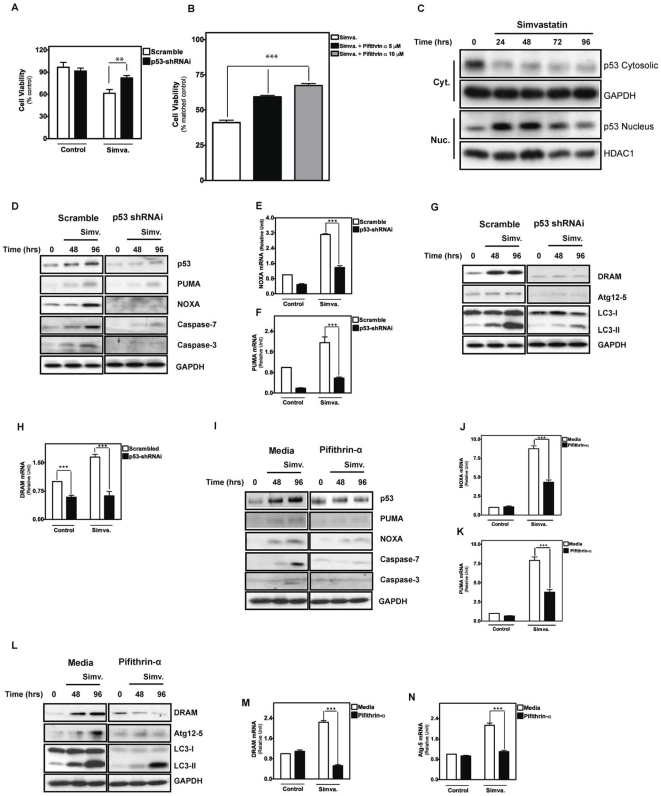
Statins inhibit the proximal steps of cholesterol biosynthesis, and are linked to health benefits in various conditions, including cancer and lung disease. We have previously investigated apoptotic pathways triggered by statins in airway mesenchymal cells, and identified reduced prenylation of small GTPases as a primary effector mechanism leading to p53-mediated cell death. Here, we extend our studies of statin-induced cell death by assessing endpoints of both apoptosis and autophagy, and investigating their interplay and coincident regulation. Using primary cultured human airway smooth muscle (HASM) and human airway fibroblasts (HAF), autophagy, and autophagosome formation and flux were assessed by transmission electron microscopy, cytochemistry (lysosome number and co-localization with LC3) and immunoblotting (LC3 lipidation and Atg12-5 complex formation). Chemical inhibition of autophagy increased simvastatin-induced caspase activation and cell death. Similarly, Atg5 silencing with shRNA, thus preventing Atg5-12 complex formation, increased pro-apoptotic effects of simvastatin. Simvastatin concomitantly increased p53-dependent expression of p53 up-regulated modulator of apoptosis (PUMA), NOXA, and damage-regulated autophagy modulator (DRAM). Notably both mevalonate cascade inhibition-induced autophagy and apoptosis were p53 dependent: simvastatin increased nuclear p53 accumulation, and both cyclic pifithrin-α and p53 shRNAi partially inhibited NOXA, PUMA expression and caspase-3/7 cleavage (apoptosis) and DRAM expression, Atg5-12 complex formation, LC3 lipidation, and autophagosome formation (autophagy). Furthermore, the autophagy response is induced rapidly, significantly delaying apoptosis, suggesting the existence of a temporally coordinated p53 regulation network. These findings are relevant for the development of statin-based therapeutic approaches in obstructive airway disease.


Conflict of interest statement

Competing Interests: I have read the journal's policy and have the following conflict: AJH has reveived an unrestricted Collaborative Innovative Research Fund operating grant from GlaxoSmithKline. This does not alter our adherence to all the PLoS ONE policies on sharing data and materials.

Figures

Figure 1
Figure 1. Simvastatin induces autophagy in primary human airway smooth muscle (HASM) cells and human airway fibroblasts (HAF).
(A) HASM cells were either left untreated (top panel) or they were treated with 10 µM simvastatin (lower panels) for 72 hrs. Cells were then imaged by TEM. Magnification: 4.6×10³. Structures identified as autophagosomes are indicated with black arrows. Lysosomes (ly), fused autophagosomes and lysosomes (a-1 fusion) and late autophagolysosomes (al) are highlighted in magnified images of each cytosolic vesicle. The scale bar represents 2 micron in all the top row and left panel in the middle. The scale bar in the right side panel in the middle row represents to 1 micron. The lower row shows enlarged images of “ly”, “a-l fusion” and “al” regions highlighted by broken lines in the right hand panel of the middle row. (B) Quantification of classic autophagosomes (exclusive of large lucent vesicles seen in low magnification images of Fig. 1A) in six different views of TEM images in controls and simvastatin (10 µM, 72 hrs) treatments (with the same magnification) indicated significant difference of autophagosome between control and treatment groups (P<0.001) (C) HASM treated with simvastatin (+Simva, 10 µM, 72 hrs) showed increased in Lysotracker Red staining, a marker of lysosomal activation. (D) HASM treated with simvastatin (+Simva, 10 µM, 72 hrs) showed an increase in punctuate staining for LC3-β (green), a marker of autophagy. (E) Quantification of LC3β puncta in six different views of immunofluorescence images in controls and simvastatin (10 µM, 72 hrs) treatments (with the same magnification) indicated significant difference of LC3β puncta between control and treatment groups (P<0.001) (F) HASM cells treated with simvastatin showed an increase in co-localization of Lysotracker Red and LC3-β (green), indicating the fusion of lysosome and autophagosome to form an autophagolysosome. (G) Western blot analysis of cell lysates from HASM and HAF. Cells were treated with 10 µM simvastatin for the indicated time periods, and then immunoblotted using the indicated specific antibodies. BNIP3 appears as both a monomer (30 kDa) and a dimer (60 kDa). Glyceraldehyde 3-phosphate dehydrogenase (GAPDH) was used as loading control. (H) Densitometry analysis of LC3 II formation in HASM and HAF. Data represent means ± s.e. mean of three independent experiments, using 3 different cell lines. For each experiment LC3 II compared to control, and GAPDH was used as a loading control.
Figure 2
Figure 2. Mevalonate co-treatment inhibits simvastatin-induced apoptosis and autophagy.
(A) Protein immunoblotting of cell lysates from HASM cells treated with 10 µM simvastatin with and without 2.5 mM mevalonate pretreatment, for the indicated time periods. Specific antibodies were used as indicated to detect levels of LC3-II, and the cleavage of caspases-3. GAPDH was used as loading control. (B) Cell viability of HASM cells measured following treatment with 10 µM simvastatin (Simva.) and/or 2.5 mM mevalonate (Mev.) as indicated. HASM were pretreated 4 hrs with indicated concentration of mevalonate and then co-treated for 96 hrs with simvastatin. Results are expressed as mean ± SD of 9 independent experiments using three different sources (donors) of HASM cells. NS, not significant.
Figure 3
Figure 3. Autophagy inhibition increases simvastatin-induced cell death in HASM and HAF.
(A&B) Side by side comparison of simvastatin-induced apoptosis (sub-G1 population of the cells) and autophagy (LC3 II formation) in HASM and HAF. Mevalonate cascade inhibition induced an early autophagy response and later apoptotic response. At each time point LC3-II level relative to its time matched control are normalized with time zero LC3-II levels to highlight temporal trends. Data represent means ± s.e. mean of three independent experiments, using 3 different cell lines. Cell viability was measured in cultured HASM and HAF after treatment with 10 µM simvastatin for 96 hrs with and without pretreatment with the following inhibitors of autophagy: (C, E) 1.25 or 2.5 mM 3-MA; (D, F) 0.01 or 0.02 µM Baf-A1. Results are expressed as percentage of corresponding time point control and represent the means ± SD of 12 independent experiments in three different sets of donor-matched HASM and HAF **, P<0.01; ***, P<0.001. (G) HASM cells co-treated with 10 µM simvastatin for 48 hrs with and without 0.02 µM Baf-A1, photographed under phase contrast microscopy settings. Arrows indicates partially detached cells with condensed morphology.(H) Baf-A1 enhanced LC3-II level in simvastatin treated cells. HASM were treated with simvastatin (10 µM) in indicated time points in presence and absence of Baf-A1. Baf-A1-simvastatin increased LC3-II level compared to simvastatin treatment. (I) 3-MA decreased LC3-II level in simvastatin treated cells. HASM were treated with simvastatin (10 µM) in indicated time points in presence and absence of 3-MA. 3-MA-simvastatin increased LC3-II level compared to simvastatin treatment.
Figure 4
Figure 4. Autophagy inhibition increases apoptosis in HASM and HAF treated with simvastatin.
(A, B). HASM were pretreated with 0.02 µM Baf-A1 in combination with 10 µM simvastatin for 96 hrs and the sub-G1 population was quantified using the Nicoletti method. Results shown are mean ± SD of 3 independent experiments in HASM primary cell lines from two different donors. **, P<0.01, compared to time-matched control. (B&C) Measurement of caspase activity in HASM and HAF co-treated with 10 µM simvastatin and 0.02 µM Baf-A1. Caspase-3/-7 activity were measured in treated cells at the indicated time points and compared to time-matched controls. ***, P<0.001. (D) Protein immunoblots used to access levels of cleaved caspases as well as the appearance of LC3-II in HASM treated with 10 µM simvastatin and 0.02 µM Baf-A1, for the indicated time periods. Detection of GAPDH served as a loading control.
Figure 5
Figure 5. Inhibition of Atg5 and Atg7 by specific shRNAi resulted in an increase of cell death in simvastatin-treated HASM.
(A) Protein immunoblotting demonstrate that ATG5 shRNAi significantly inhibited Atg5-12 complex formation. Scrambled sequence was used as an RNAi control. (B) Protein immunoblotting of simvastin-treated HASM, both control and ATG5 shRNAi. Specific antibodies against the indicated proteins were used, with GAPDH serving a loading control. (C) Cell viability assay (MTT assay) using control and ATG5 shRNAi HASM cells, with and without simvastatin treatment (10 µM, 96 hrs) showed that ATG5 shRNAi significantly increased simvastatin induced cell death (P<0.05). (D) Protein immunoblot demonstrating that ATG7 shRNAi significantly inhibited Atg7 expression. Scrambled sequence was used as an RNAi control. (E) Immunoblotting of simvastatin-treated HASM after infection with lentivirus harboring control or ATG7 shRNAi. Specific antibodies against the indicated proteins were used, with GAPDH serving a loading control. (F) Cell viability assay (MTT assay) using control and ATG7 shRNAi HASM cells, with and without simvastatin treatment (10 µM, 96 hrs) showed that ATG7 shRNAi significantly increased simvastatin induced cell death (P<0.01).
Figure 6
Figure 6. Simvastatin-induced apoptosis and autophagy are mediated via p53-dependent pathway.
(A) Cell viability assay carried out on cells transduced with shRNAi targetting p53 or scrambled sequence as a control, with and without treatment with 10 µM simvastatin for 96 hours. Results are expressed as percentage of corresponding control and represent mean ± SD of 6 independent experiments (**: P<0.01). (B) HASM assesses using MTT assay. Cell viability was measured by comparing each treatment with corresponding control. Results reflect mean ± SD of four independent experiments (* * *: P<0.001). (C) Immunoblotting of cytosolic (Cyt) and nuclear (Nuc) extracts from HASM cells treated with 10 µM simvastatin for the indicated time points, using p53 antibody to detect nuclear translocation. HASM were treated with simvastatin (10 µM) for indicated time points (0–96 hrs). Glyceraldehyde 3-phosphate dehydrogenase (GAPDH) and histone deacetylase 1 (HDAC1) were used as loading controls for cytoplasmic and nuclear fraction, respectively. (D) Immunoblots of effects of p53 shRNAi silencing on apoptosis markers. HASM cells stably infected with scrambled shRNAi (left panels) and p53 shRNAi (right panels) were treated with simvastatin (10 µM) for indicated time points (0–96 hrs). NOXA, PUMA, and cleaved caspase-3 and -7 abundance were measured. (E, F) Quantitative RT-PCR to demonstrate the effect of p53-shRNAi on PUMA (E) and NOXA (F) expression. Results reflect mean ± SD of three independent experiments (* * *: P<0.001). (G) Immunoblots of effects of p53 shRNAi silencing on autophagy markers. HASM cells stably infected with scrambled shRNAi (left panels) and p53 shRNAi (right panels) were treated with simvastatin (10 µM) for indicated time points (0–96 hrs). DRAM, ATG-Atg12, and LC3-I and –II were assessed. (H) Quantitative RT-PCR to demonstrate the effect of p53-shRNAi on DRAM expression. Results reflect mean ± SD of three independent experiments (* * *: P<0.001). (I) Immunoblotting of cell lysates from cells treated with 10 µM simvastatin for the indicated time periods in the presence or absence of the p53 inhibitor pifithrin-α, using antibodies specific for the indicated proteins. GAPDH was used as loading control. (J, K) Quantitative RT-PCR to demonstrate the effect of pifithrin-α on NOXA (J) and PUMA (K) expression. Results reflect mean ± SD of three independent experiments (* * *: P<0.001). (L) Immunoblotting of cell lysates from cells treated with 10 µM simvastatin for the indicated time periods in the presence or absence of the p53 inhibitor pifithrin-α, using antibodies specific for the indicated proteins. GAPDH was used as loading control. (M, N) Quantitative RT-PCR to demonstrate the effect of pifithrin-α on DRAM (N) and Atg5 (N) expression. Results reflect mean ± SD of three independent experiments (* * *: P<0.001).

Similar articles

Cited by

References

    1. Ghavami S, Hashemi M, Ande SR, Yeganeh B, Xiao W, et al. Apoptosis and cancer: mutations within caspase genes. J Med Genet. 2009;46:497–510. - PubMed
    1. Levine B, Klionsky DJ. Development by self-digestion: molecular mechanisms and biological functions of autophagy. Dev Cell. 2004;6:463–477. - PubMed
    1. Meijer AJ, Codogno P. Regulation and role of autophagy in mammalian cells. Int J Biochem Cell Biol. 2004;36:2445–2462. - PubMed
    1. Klionsky DJ, Emr SD. Autophagy as a regulated pathway of cellular degradation. Science. 2000;290:1717–1721. - PMC - PubMed
    1. Yoshimori T. Autophagy: a regulated bulk degradation process inside cells. Biochem Biophys Res Commun. 2004;313:453–458. - PubMed

Publication types

MeSH terms