. 2011 Jan 31;6(1):e16551.
doi: 10.1371/journal.pone.0016551.

Within-host dynamics of the hepatitis C virus quasispecies population in HIV-1/HCV coinfected patients

Affiliations

Within-host dynamics of the hepatitis C virus quasispecies population in HIV-1/HCV coinfected patients

Flavia Bernini et al. PLoS One. .

Abstract

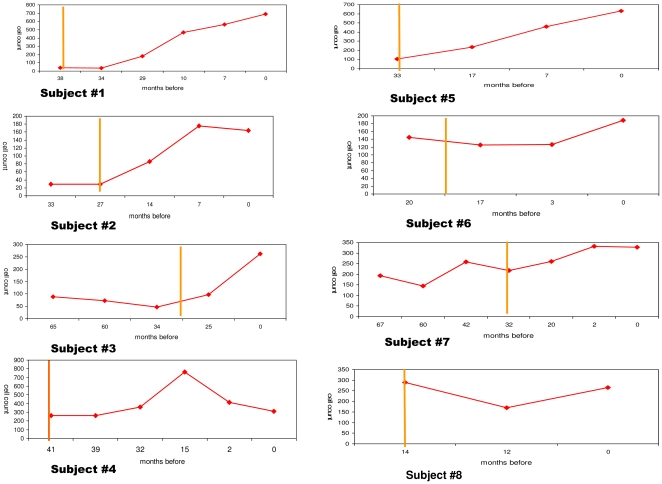
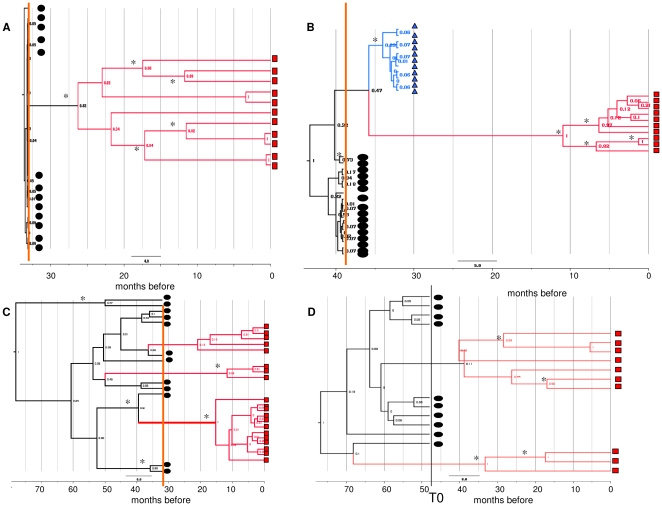
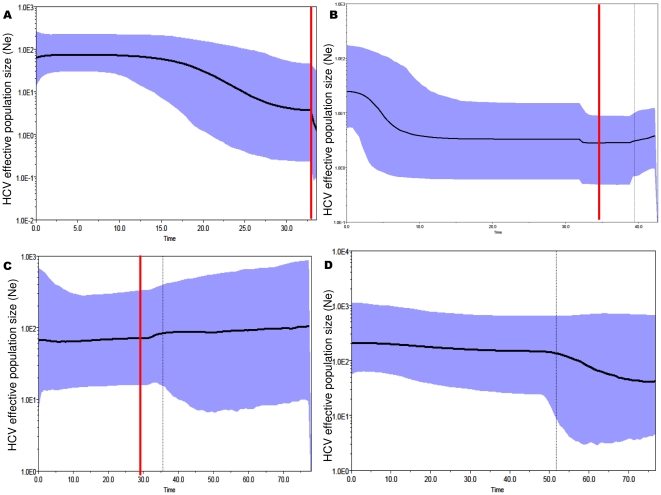
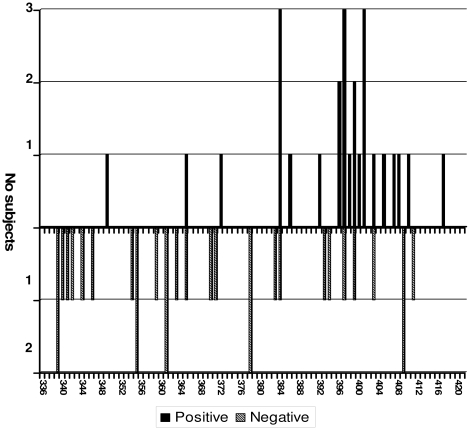
HIV/HCV coinfected individuals under highly active antiretroviral therapy (HAART) represent an interesting model for the investigation of the role played by the immune system in driving the evolution of the HCV quasispecies. We prospectively studied the intra-host evolution of the HCV heterogeneity in 8 coinfected subjects, selected from a cohort of 32 patients initiating HAART: 5 immunological responders (group A) and 3 immunological non-responders (group B), and in two HCV singly infected controls not assuming drugs (group C). For all these subjects at least two serial samples obtained at the first observation (before HAART) and more than 1 year later, underwent clonal sequence analysis of partial E1/E2 sequences, encompassing the whole HVR1. Evolutionary rates, dated phylogenies and population dynamics were co-estimated by using a Bayesian Markov Chain Monte Carlo approach, and site specific selection pressures were estimated by maximum likelihood-based methods. The intra-host evolutionary rates of HCV quasispecies was 10 times higher in subjects treated with HAART than in controls without immunodeficiency (1.9 and 2.3 × 10(-3) sub/site/month in group A and B and 0.29 × 10(-3) sub/site/month in group C individuals). The within-host Bayesian Skyline plot analysis showed an exponential growth of the quasispecies populations in immunological responders, coinciding with a peak in CD4 cell counts. On the contrary, quasispecies population remained constant in group B and in group C controls. A significant positive selection pressure was detected in a half of the patients under HAART and in none of the group C controls. Several sites under significant positive selection were described, mainly included in the HVR1. Our data indicate that different forces, in addition to the selection pressure, drive an exceptionally fast evolution of HCV during HAART immune restoration. We hypothesize that an important role is played by the enlargement of the viral replicative space.


Conflict of interest statement

Competing Interests: The authors have declared that no competing interests exist.

Figures

Figure 1
Figure 1. Changes in CD4 cell counts during HAART treatment of 5 group A and 3 group B HIV/HCV coinfected patients.
Curves represent the absolute number of CD4 cells/µl of peripheral blood (y axis) over time (x axis-months before the most recent sample) for each HAART treated patient. Subjects#1-5: immunological responders (group A); subjects#6-8 non responders (group B). The vertical yellow line indicates time of HAART initiation.
Figure 2
Figure 2. Bayesian phylogenetic trees of the HCV E1/E2 sequences at different times during follow-up.
Four exemplary trees obtained from two immunological responders to HAART: subject #5 (A); subject #4 (B), one non-responder: subject #7 (C), and one patient not receiving HAART: subject #9 (D). The clones isolated in the basal, intermediate and/or last samples are indicated by black circles, blue triangles and red squares, respectively. The other trees are shown in Supporting Figure 1 (Figure S1). The branches are shown in units of time, and the numbers on the branches indicate posterior probabilities. Asterisks indicate significant branches (pp>0.65). The months before the last sample are shown in the scale at the bottom of the trees. The vertical line indicates time of HAART initiation (orange line) or T0 (black line).
Figure 3
Figure 3. Intra-host population dynamics of the HCV QS during follow-up.
Bayesian skyline plots of the effective HCV population size (y axis) over time (months before the last sample; x axis) in four representative subjects (the same of Figure 1), two immunological responders: subject #5 (A) and subject #4 (B), one non-responder: subject #7 (C), and one patient not receiving HAART: subject #9 (D). The graphs represent the median estimate (black line) of the effective population number of HCV (the number of infectious genomes effectively contributing to the next generation) with shaded area representing the 95% high posterior intervals. The vertical line corresponds to the time of HAART initiation (red) or T0 (black), and the dotted line corresponds to the lower 95% HPD limit of the root tMRCA. The other BSPs are shown in Supporting Figure 2 (Figure S2).
Figure 4
Figure 4. Frequency and distribution of the sites under significant positive and negative selection pressure inE1/E2.
The bars indicate the number of patients (y axis) showing positive (filed bars-upward) or negative (striped bars-downward) selection at each site (x axis).

Similar articles

Cited by

References

    1. Eigen M. Selforganization of matter and the evolution of biological macromolecules. Naturwissenschaften. 1971;58:465–523. - PubMed
    1. Farci P, Purcell RH. Clinical significance of hepatitis C virus genotypes and quasispecies. Semin Liver Dis. 2000;20:103–126. - PubMed
    1. Pawlotsky JM, Tsakiris L, Roudot-Thoraval F, Pellet C, Stuyver L, et al. Relationship between hepatitis C virus genotypes and sources of infection in patients with chronic hepatitis C. J Infect Dis. 1995;171:1607–1610. - PubMed
    1. Ray SC, Wang YM, Laeyendecker O, Ticehurst JR, Villano SA, et al. Acute hepatitis C virus structural gene sequences as predictors of persistent viremia: hypervariable region 1 as a decoy. J Virol. 1999;73:2938–2946. - PMC - PubMed
    1. Allain JP, Dong Y, Vandamme AM, Moulton V, Salemi M. Evolutionary rate and genetic drift of hepatitis C virus are not correlated with the host immune response: studies of infected donor-recipient clusters. J Virol. 2000;74:2541–2549. - PMC - PubMed