. 2011 Jan 31;6(1):e16648.
doi: 10.1371/journal.pone.0016648.

Propofol directly increases tau phosphorylation

Affiliations

Propofol directly increases tau phosphorylation

Robert A Whittington et al. PLoS One. .

Abstract

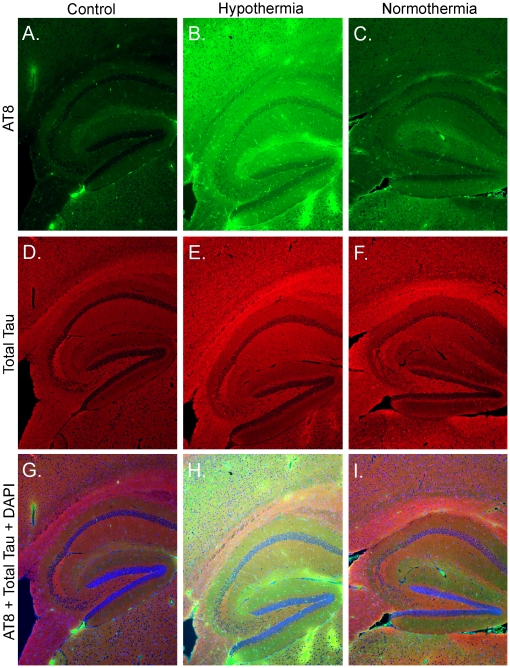
In Alzheimer's disease (AD) and other tauopathies, the microtubule-associated protein tau can undergo aberrant hyperphosphorylation potentially leading to the development of neurofibrillary pathology. Anesthetics have been previously shown to induce tau hyperphosphorylation through a mechanism involving hypothermia-induced inhibition of protein phosphatase 2A (PP2A) activity. However, the effects of propofol, a common clinically used intravenous anesthetic, on tau phosphorylation under normothermic conditions are unknown. We investigated the effects of a general anesthetic dose of propofol on levels of phosphorylated tau in the mouse hippocampus and cortex under normothermic conditions. Thirty min following the administration of propofol 250 mg/kg i.p., significant increases in tau phosphorylation were observed at the AT8, CP13, and PHF-1 phosphoepitopes in the hippocampus, as well as at AT8, PHF-1, MC6, pS262, and pS422 epitopes in the cortex. However, we did not detect somatodendritic relocalization of tau. In both brain regions, tau hyperphosphorylation persisted at the AT8 epitope 2 h following propofol, although the sedative effects of the drug were no longer evident at this time point. By 6 h following propofol, levels of phosphorylated tau at AT8 returned to control levels. An initial decrease in the activity and expression of PP2A were observed, suggesting that PP2A inhibition is at least partly responsible for the hyperphosphorylation of tau at multiple sites following 30 min of propofol exposure. We also examined tau phosphorylation in SH-SY5Y cells transfected to overexpress human tau. A 1 h exposure to a clinically relevant concentration of propofol in vitro was also associated with tau hyperphosphorylation. These findings suggest that propofol increases tau phosphorylation both in vivo and in vitro under normothermic conditions, and further studies are warranted to determine the impact of this anesthetic on the acceleration of neurofibrillary pathology.


Conflict of interest statement

Competing Interests: The authors have declared that no competing interests exist.

Figures

Figure 1
Figure 1. Tau phosphorylation in mouse hippocampal tissue 30 min following the administration of propofol under hypothermic (A) or normothermic (B) conditions.
Hippocampal protein extracts were separated by SDS-PAGE and levels of tau phosphorylation were determined using antibodies directed at the AT8 (Ser202/Thr205;A1,B1), CP13 (Ser202;A2,B2), and PHF-1 (Ser396/Ser404;A3,B3) phosphoepitopes, or total tau (A4, B4). Relative immunoreactive band intensities are expressed as a percent of control (Ctl; intralipid) and are displayed for each phosphoepitope and total tau. For each condition, 2 representative data are displayed with Ctl (n = 4), and Prop (n = 5). Data are expressed as mean ± SD. *** denotes P<0.001, ** denotes P<0.01, and * denotes P<0.05 vs. Ctl with unpaired t-test.
Figure 2
Figure 2. Regional anatomical localization of tau phosphorylation following 30 min of anesthesia with propofol.
Fluorescence photomicrographs of hippocampal sagittal sections are shown with AT8 (Green, A,B,C), Total Tau (Red, D,E,F), or merged with DAPI (Green-Red-Blue, G,H,I), for the following conditions: Control (Intralipid, A,D,G), Hypothermia (B,E,H), and Normothermia (C,F,G). All images were taken at 5x magnification.
Figure 3
Figure 3. Tau phosphorylation in mouse hippocampal tissue 0.5 h and 2 h (A), or 0.5 h and 6 h (B) following the administration of propofol under normothermic conditions.
Hippocampal protein extracts were separated by SDS-PAGE and levels of tau phosphorylation were determined using antibodies directed at the AT8 (A1, B1), PHF-1 (A2, B2), and CP13 (A3, B3) phosphoepitopes, or Total Tau (A4, B4). Relative immunoreactive band intensities are expressed as a percent of control (Ctl; intralipid) and are displayed for each phosphoepitope and total tau. For each condition, 1 representative datum is displayed with Ctl (n = 4), 0.5 h (n = 5), 2 h (n = 5), or 6 h (n = 5). Data are expressed as mean ± SD. *, ** and *** denote P<0.05, P<0.01 and P<0.001 vs. ctl, respectively; ANOVA with Newman-Keuls post hoc test.
Figure 4
Figure 4. Tau phosphorylation in mouse cortical tissue 30 min and 2 h following the administration of propofol under normothermic conditions.
Cortical protein extracts were separated by SDS-PAGE and levels of tau phosphorylation were determined using antibodies directed at the AT8 (1), PHF-1 (2), pS262 (3), MC6 (4), and pS422 (5) phophoepitopes, or Total Tau (6). Relative immunoreactive band intensities are expressed as a percent of control (Ctl; intralipid) and are displayed for each phosphoepitope and total tau. For each condition, 1 representative datum is displayed with Ctl (n = 6), 0.5 h (n = 6), and 2 h (n = 7). Data are expressed as mean ± SD. *, and ** and denote P<0.05, and P<0.01 vs. Ctl, respectively; ANOVA with Newman-Keuls post hoc test.
Figure 5
Figure 5. Effect of propofol on tau kinases in mouse cortical tissue 0.5 h and 2 h following the administration of propofol under normothermic conditions.
Cortical protein extracts were separated by SDS-PAGE and levels of kinases were determined using antibodies directed at activated or total kinases as follow: (1) GSK-3β phospho-S9, (2) total GSK-3 (α and β), (3) phospho-ERK, (4) total ERK, (5) phospho-JNK, (6) total JNK, (7) phospho-CaMKII, (8) total CaMKII, (9) phospho-AKT, (10) total AKT, (11) CDK5, and (12) P35. Relative immunoreactive band intensities are expressed as a percent of control (Ctl; intralipid) and are displayed for each epitope. For each condition, 1 representative datum is displayed with Ctl (n = 6), 0.5 h (n = 6), and 2 h (n = 7). Data are expressed as mean ± SD. *, ** and *** denote P<0.05, P<0.01 and P<0.001 vs. ctl, respectively; ANOVA with Newman-Keuls post hoc test.
Figure 6
Figure 6. Effect of propofol on tau phosphatases in mouse cortical tissue 0.5 h and 2 h following the administration of propofol under normothermic conditions.
Cortical protein extracts were separated by SDS-PAGE and levels of phosphatases were determined using antibodies directed at the following proteins: (1) PP1 catalytic subunit, (2) PP2B catalytic subunit, and (3) PP2A catalytic subunit. Relative immunoreactive band intensities are expressed as a percent of control (Ctl; intralipid) and are displayed for each epitope. For each condition, 1 representative datum is displayed. (4) PP2A activity was measured with the PP2A Immunoprecipitation Phosphatase BioAssay Kit from US Biological and values expressed as percentage of control. All data are expressed as mean ± SD. * and ** denote P<0.05 and P<0.01 vs. ctl, respectively; Ctl (n = 6), 0.5 h (n = 6), and 2 h (n = 7); ANOVA with Newman-Keuls post hoc test.
Figure 7
Figure 7. Effect of propofol on tau phosphorylation in Tau-SH-SY5Y cells.
Cells were harvested after 1 h incubation at 37°C (n = 4) or 30°C (n = 3) in the absence of propofol (A), or following 1 h exposure to 10% intralipid in DMEM (Ctl, n = 3) or propofol (Prop, n = 5) at 3 µg/ml (16.8 µM), both at 37°C (B). Cell lysate protein extracts were separated by SDS-PAGE and the level of tau phosphorylation was determined using antibodies directed at the AT8 (A1, B1), CP13 (B2), or PHF-1 (B3) phosphoepitopes, or total tau (A2, B4). Relative immunoreactive band intensities are expressed as a percent of control and are displayed for each phosphoepitope and total tau. Tau phosphoepitopes are normalized on total tau. For each condition, 2 representative data are displayed. Data are expressed as mean ± SD, with *, **, and *** denoting P<0.05, P<0.01 and P<0.001 vs. ctl, respectively with unpaired t-test.

References

    1. Brookmeyer R, Johnson E, Ziegler-Graham K, Arrighi HM. Forecasting the global burden of Alzheimer's disease. Alzheimers Dement. 2007;3:186–191. - PubMed
    1. Glenner GG, Wong CW. Alzheimer's disease: initial report of the purification and characterization of a novel cerebrovascular amyloid protein. Biochem Biophys Res Commun. 1984;120:885–890. - PubMed
    1. Grundke-Iqbal I, Iqbal K, Quinlan M, Tung YC, Zaidi MS, et al. Microtubule-associated protein tau. A component of Alzheimer paired helical filaments. J Biol Chem. 1986;261:6084–6089. - PubMed
    1. Grundke-Iqbal I, Iqbal K, Tung YC, Quinlan M, Wisniewski HM, et al. Abnormal phosphorylation of the microtubule-associated protein tau (tau) in Alzheimer cytoskeletal pathology. Proc Natl Acad Sci U S A. 1986;83:4913–4917. - PMC - PubMed
    1. Montejo de Garcini E, Serrano L, Avila J. Self assembly of microtubule associated protein tau into filaments resembling those found in Alzheimer disease. Biochem Biophys Res Commun. 1986;141:790–796. - PubMed

Publication types