. 2011 Jan 31;6(1):e15986.
doi: 10.1371/journal.pone.0015986.

A novel soluble immune-type receptor (SITR) in teleost fish: carp SITR is involved in the nitric oxide-mediated response to a protozoan parasite

Affiliations

A novel soluble immune-type receptor (SITR) in teleost fish: carp SITR is involved in the nitric oxide-mediated response to a protozoan parasite

Carla M S Ribeiro et al. PLoS One. .

Abstract

Background: The innate immune system relies upon a wide range of germ-line encoded receptors including a large number of immunoglobulin superfamily (IgSF) receptors. Different Ig-like immune receptor families have been reported in mammals, birds, amphibians and fish. Most innate immune receptors of the IgSF are type I transmembrane proteins containing one or more extracellular Ig-like domains and their regulation of effector functions is mediated intracellularly by distinct stimulatory or inhibitory pathways.

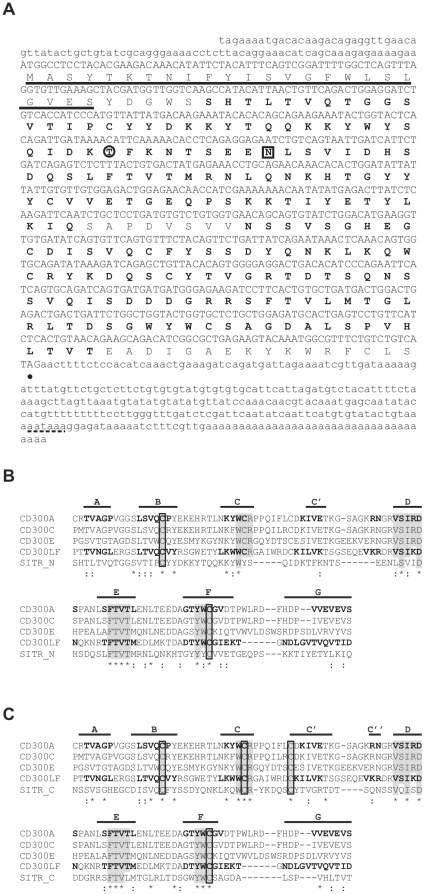
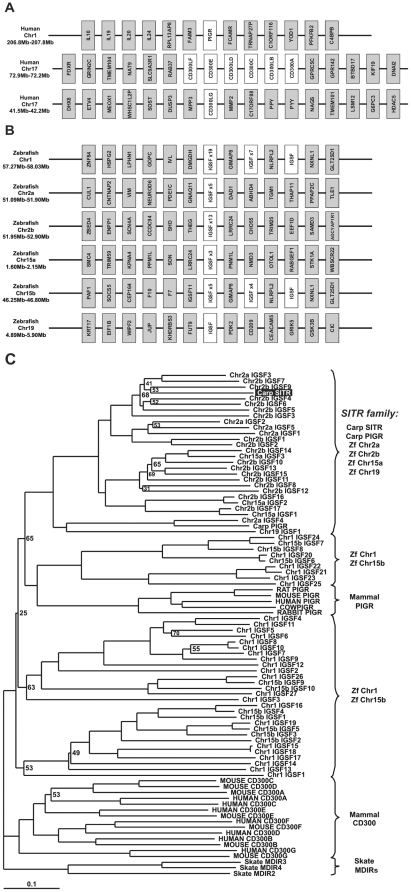
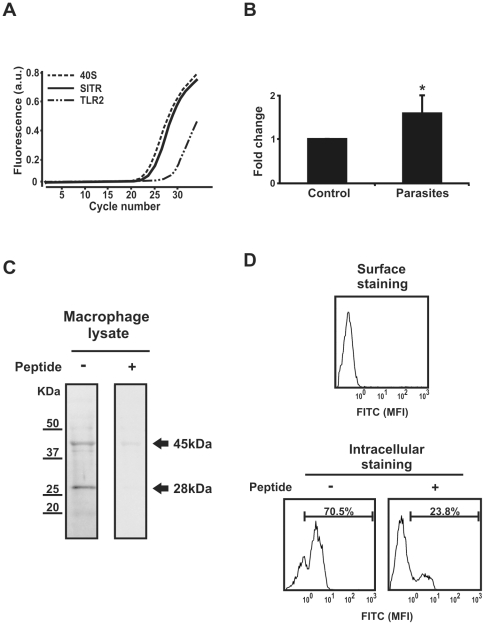
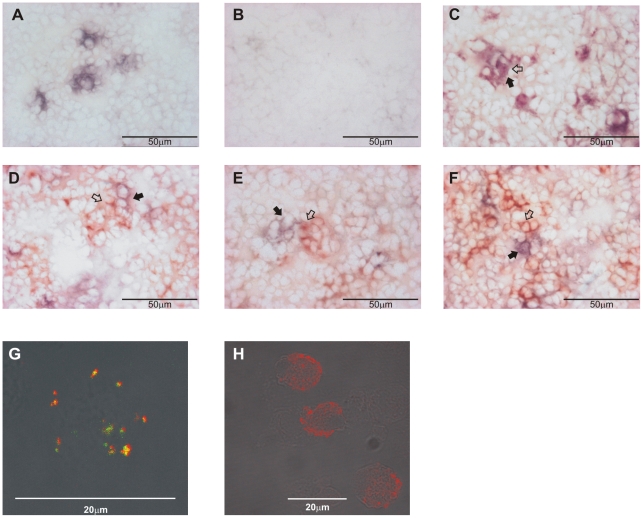
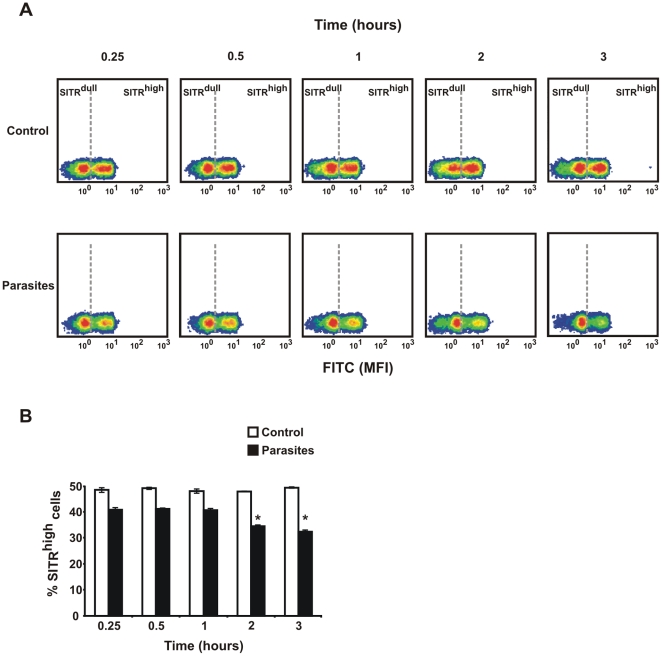
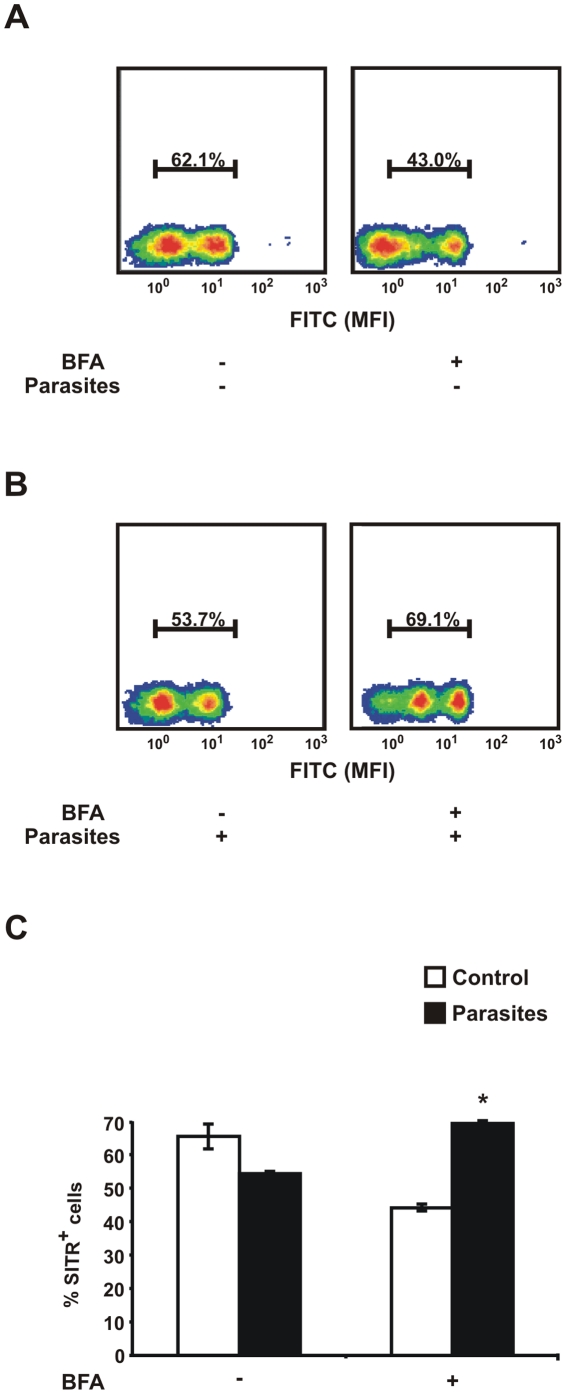
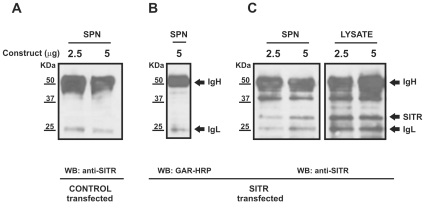
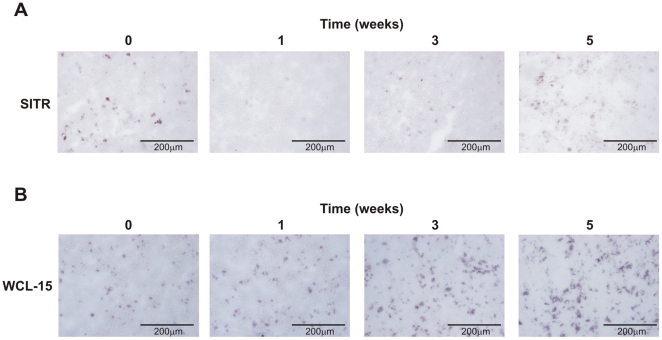
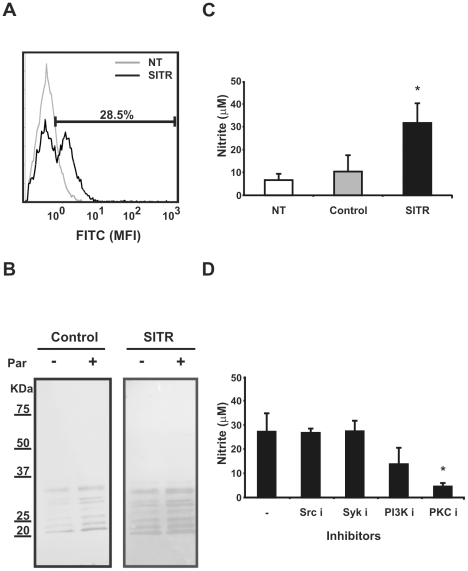
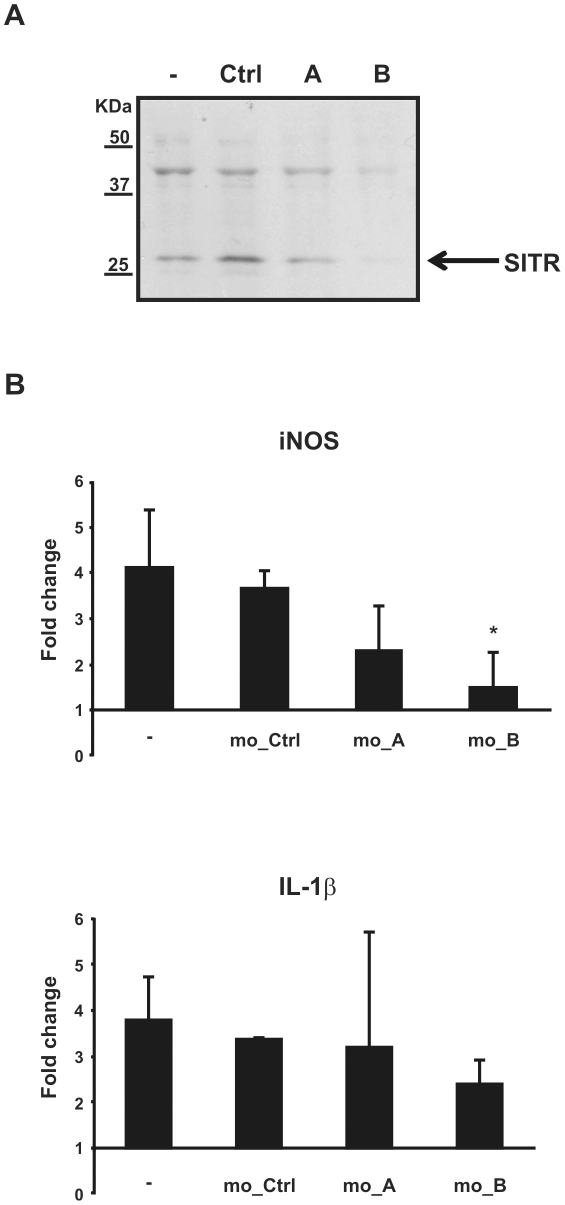
Methodology/principal findings: Carp SITR was found in a substracted cDNA repertoire from carp macrophages, enriched for genes up-regulated in response to the protozoan parasite Trypanoplasma borreli. Carp SITR is a type I protein with two extracellular Ig domains in a unique organisation of a N-proximal V/C2 (or I-) type and a C-proximal V-type Ig domain, devoid of a transmembrane domain or any intracytoplasmic signalling motif. The carp SITR C-proximal V-type Ig domain, in particular, has a close sequence similarity and conserved structural characteristics to the mammalian CD300 molecules. By generating an anti-SITR antibody we could show that SITR protein expression was restricted to cells of the myeloid lineage. Carp SITR is abundantly expressed in macrophages and is secreted upon in vitro stimulation with the protozoan parasite T. borreli. Secretion of SITR protein during in vivo T. borreli infection suggests a role for this IgSF receptor in the host response to this protozoan parasite. Overexpression of carp SITR in mouse macrophages and knock-down of SITR protein expression in carp macrophages, using morpholino antisense technology, provided evidence for the involvement of carp SITR in the parasite-induced NO production.

Conclusion/significance: We report the structural and functional characterization of a novel soluble immune-type receptor (SITR) in a teleost fish and propose a role for carp SITR in the NO-mediated response to a protozoan parasite.


Conflict of interest statement

Competing Interests: The authors have declared that no competing interests exist.

Figures

Figure 1
Figure 1. Carp Soluble Immune-Type Receptor (SITR) is a member of the Ig superfamily.
A. Nucleotide sequence of common carp SITR with open reading frame (upper case) and untranslated 5′ and 3′ regions (lower case). The predicted amino acid sequence is shown below the nucleotide sequence. The predicted signal peptide is underlined and the two Ig-like domains are marked in bold. The potential N-glycosylation site is boxed and the potential PKC interaction site is circled. Dot indicates the stop codon. A consensus polyadenylation signal (AATAAA) in the 3′-UTR is dashed. B. Alignment of the putative carp SITR N-proximal Ig-like domain (SITR_N, residues 30–123) with V-type Ig domains from human CD300 molecules. C. Alignment of the putative carp SITR C-proximal Ig-like domain (SITR_C, residues 132–224) with V-type Ig domains from human CD300 molecules. Asterisks indicate identity and colons denote similarity. Dashes indicate the introduced gaps to maximize the alignment. Residues characteristic of the V-type CD300 Ig-like fold and conserved between carp SITR (GenBank Accession Number: HM370297, http://www.ncbi.nlm.nih.gov/genbank/) and human CD300A (GenBank acc no: NP_009192.2), CD300C (GenBank acc no: NP_006669.1), CD300E (GenBank acc no: NP_852114.1), CD300F (GenBank acc no: NP_620587.2) are grey shaded. Cysteines conserved between carp SITR and human CD300 molecules are boxed. Regions of β-strands, as defined by X-ray crystallography for CD300A (PDB acc no: 2Q87, http://www.rcsb.org/pdb/home/home.do) and CD300LF (PDB acc no: 2NMS) are marked in bold. The positions of the predicted β-strands for carp SITR are indicated above the sequence.
Figure 2
Figure 2. Diversity of carp SITR-related molecules encoded in the zebrafish genome.
A. Schematic organization of human CD300 and PIGR loci on chromosomes (Chr) 17 and chromosome 1. B. Schematic organization of zebrafish SITR loci identified on chromosome 1, chromosome 2 (sites 2a and 2b), chromosome 15 (sites 15a and 15b) and chromosome 19. C. Unrooted phylogenetic tree showing the relationship between the carp SITR amino acid sequences for the full-length molecule with other known vertebrate Ig-like receptor sequences. This tree was constructed by the ‘neighbour-joining’ method using the clustal X and treeview packages, and was bootstrapped 10,000 times. All bootstrap values less than 75% are shown. The GenBank accession numbers (http://www.ncbi.nlm.nih.gov/genbank/) of the human CD300 amino acid sequences are: CD300A, NP_009192.2; ; CD300B, NP_777552.2 ; CD300C, NP_006669.1 ; CD300D, NP_001108624.1; CD300E, NP_852114.1; CD300F, NP_620587.2 ; CD300G, NP_660316.1. The GenBank accession numbers (http://www.ncbi.nlm.nih.gov/genbank/) of the mouse CD300 amino acid sequences are: CD300A, CAM18755.1; CD300B, NP_954691.2 ; CD300C, NP_954695.1; CD300D, NP_663412.1 ; CD300E, NP_742047.1; CD300F, NP_663609.2; CD300G, NP_082263.2. The GenBank accession numbers (http://www.ncbi.nlm.nih.gov/genbank/) of the skate sequences are: MDIR2, ABC86796.1; MDIR3, ABC86797.1; MDIR4, ABC86799.1. The GenBank accession numbers (http://www.ncbi.nlm.nih.gov/genbank/) of the mammalian PIGR are: RAT, NP_036855.1; MOUSE, NP_035212.2; HUMAN, NP_002635.2; COW, NP_776568.1; RABBIT, NP_001164516.1. The Genbank accession numbers (http://www.ncbi.nlm.nih.gov/genbank/) of the carp sequences are: PIGR, ADB97624.1; SITR, HM370297.
Figure 3
Figure 3. SITR gene and protein expression in carp macrophages.
A. Real-time qPCR cycle profile for SITR in naïve carp macrophages in comparison with the house keeping gene 40S ribosomal protein S11 and Toll-Like Receptor (TLR)2 as reference genes. B. SITR gene expression in carp macrophages after stimulation for 6 h with live T. borreli protozoan parasites (0.5×10⁶ per well). mRNA levels of SITR relative to the house keeping gene 40S ribosomal protein S11 are expressed as fold change relative to unstimulated cells (control). Bars show averages ± SD of n = 4 fish. Symbol (*) shows a significant (P≤0.05) difference compared with unstimulated cells. C. Western blot analysis of macrophage lysates using as primary antibody the anti-SITR antibody or the anti-SITR antibody pre-incubated with the immunizing peptide (20µg/ml). D. Surface and intracellular SITR protein staining detected by flow cytometry using anti-SITR antibody or anti-SITR antibody pre-incubated with the immunizing peptide (20µg/ml).
Figure 4
Figure 4. SITR protein is mainly expressed in myeloid cells.
A. Anti-SITR immunoreactivity (blue) in spleen of naïve carp. B. Anti-SITR immunoreactivity (blue) after pre-incubation of the anti-SITR antibody with the immunizing peptide (20µg/ml) in spleen of naïve carp. C. Double-staining for monocytes/macrophages (WCL-15; red) and SITR (blue) in spleen of naïve carp. D. Double-staining for neutrophilic granulocytes (TCL-BE8; red) and SITR (blue) in spleen of naïve carp. E. Double-staining for B cells (WCI-12; red) and SITR (blue) in spleen of naïve carp. F. Double-staining for thrombocytes (WCL-6; red) and SITR (blue) in spleen of naïve carp. G. Double-staining for monocytes/macrophages (WCL-15; green) and SITR (red) in macrophage-enriched cell fractions from head-kidney of naïve carp. H. Staining for SITR (red) in macrophage-enriched cell fractions from head-kidney of naïve carp. Typical red-stained (WCL-15+, TCL-BE8+, WCI-12+ or WCL-6+) cells are indicated with open arrows and typical blue-stained (SITR+) cells with closed arrows. Note that in panel C, it is difficult to distinguish between red- and blue-stained cells. Co-localization of both signals results in the indicated dark purple-stained cells.
Figure 5
Figure 5. Effect of parasite stimulation on percentage of SITR-positive cells.
A. Density plots of intracellular SITR protein expression analysed by flow cytometry using anti-SITR antibody. Macrophages were stimulated with live T. borreli parasites (0.5×10⁶ per well) for different time periods or left untreated as negative control. Two populations of cells could be defined on the basis of SITR protein expression: SITRdull and SITRhigh for the density plot representing negative control cells at 0.25 h. The separation (grey dashed line) between SITRdull and SITRhigh gates was defined based on each negative control (at 0.25, 0.5, 1, 2 and 3 hours) and set as the line separating the two populations. The same SITRdull and SITRhigh gate settings were used to analyse the parasite-stimulated samples at the respective time points. Density plots shown are representative of one out of three experiments. Mean fluorescent intensity (MFI) of FITC and PE are represented in X and Y axes, respectively. B. Percentage SITRhigh cell populations (averages ± SD of n = 3 fish) after stimulation of macrophages with live T. borreli parasites for different time periods, or left untreated as negative control. Symbol (*) indicates a significant (P≤0.05) difference in parasite-stimulated cells compared with unstimulated cells at the same time point.
Figure 6
Figure 6. Intracellular SITR protein sorting.
A. Carp macrophages were incubated for 16.5 h with brefeldin A (BFA, 2 µg/ml) or left untreated as negative control. B. Macrophages were pre-incubated for 30 min with BFA (2 µg/ml) or left untreated as negative control and further stimulated for 16 h with live T. borreli parasites (0.5×10⁶ per well). Percentage (%) of cells with an MFI higher than 10° was defined as % SITR+ cells for all the density plots based on the plot obtained with the negative isotype control. The density plots of intracellular SITR protein expression analysed by flow cytometry using anti-SITR antibody are representative of four experiments. Mean fluorescent intensity (MFI) of FITC and PE are represented in X and Y axes, respectively. C. Percentage SITRhigh cell populations (averages ± SD of n = 4 fish) after pre-incubation for 30 min with BFA, or left untreated as negative control, followed by stimulation with live T. borreli parasites for 16 h. Symbol (*) indicates a significant (P≤0.05) difference in parasite stimulated cells compared with unstimulated cells.
Figure 7
Figure 7. Detection of SITR protein in the supernatant of SITR-transfected HEK 293 cells.
TLR2ÄTIR (negative control)- and SITR-transfected HEK 293 cells were stimulated with live T. borreli parasites (106 per well) for 16 h. Supernatants and cell lysates from transfected HEK 293 cells were collected and SITR was immunoprecipitated using the affinity purified anti-SITR antibody. A. Western blots of immunoprecipitated supernatants (SPN) of TLR2ÄTIR-transfected (negative control, 2.5 or 5µg construct ) HEK 293 cells. SITR expression was evaluated using anti-SITR antibody. B. Western blots of immunoprecipitated supernatants (SPN) of SITR-transfected (5µg construct) HEK 293 cells. Co-elution of the heavy (IgH) and light chain (IgL) of the anti-SITR antibody during the immunoprecipitation protocol was confirmed using goat-anti-rabbit conjugated with horseradish peroxidase (GAR-HRP). C. Western blots of immunoprecipitated supernatants and cell lysates of SITR-transfected (2.5 or 5µg construct) HEK 293 cells. SITR expression was evaluated using anti-SITR antibody.
Figure 8
Figure 8. SITR protein expression during in vivo T. borreli infection.
A. Anti-SITR immunoreactivity (blue) in spleen tissue from non-infected fish (control) and at 1, 3 and 5 weeks post-infection with T. borreli parasites. B. Staining for monocytes/macrophages (WCL-15; red) in spleen tissue from non-infected fish (control) and at 1, 3 and 5 weeks post-infection with T. borreli parasites.
Figure 9
Figure 9. Overexpression of SITR in mouse RAW macrophages.
A. Intracellular SITR protein expression in RAW cells analysed by flow cytometry using anti-SITR antibody (1∶50). RAW cells were non-transfected (NT) or transfected with carp SITR. B. Western blot of cell lysates of TLR2ΔTIR- (control) and SITR-transfected RAW cells stimulated with live T. borreli parasites (Par, 0.5×10⁶ per well) for 15 min or left untreated as control. Tyrosine phosphorylation was evaluated using an anti-phospho tyrosine antibody. C. Nitrite concentration (averages ± SD of n = 5) in supernatants of non-transfected (NT), TLR2ÄTIR-(control) and SITR- transfected RAW cells determined by Griess reaction at 24 h. Symbol (*) indicates a significant (P≤0.05) difference compared with TLR2ÄTIR - transfected RAW cells. D. Nitrite concentration (averages ± SD of n = 3) in supernatants of SITR- transfected RAW cells pre-incubated for 30 min with inhibitors of Src kinase (Src i, PP2, 20µM), Syk kinase (Syk i, Piceatannol, 50µM), and PI3K kinase (PI3K i, LY294002, 50µM), PKC kinase (PKC i, Staurosporine, 1µM) or left untreated as control. TLR2ÄTIR-(control)- transfected RAW cells were used as negative controls (data not shown). Nitrite levels were determined by Griess reaction at 24h. Symbol (*) indicates a significant (P≤0.05) difference compared with unstimulated cells.
Figure 10
Figure 10. Knock-down of SITR protein in carp macrophages.
A. Western blot of cell lysates from carp macrophages incubated for 48 h with control morpholino (control, 5µM), SITR morpholino A (SITR_A, 5 µM) or SITR morpholino B (SITR B, 5 µM) or left untreated as control. SITR protein expression was analysed using anti-SITR antibody. B. Real-time gene expression in carp macrophages pre-incubated for 48 h with control morpholino (mo_ctrl, 5 µM), SITR morpholino A (mo_A, 5 µM) or SITR morpholino B (mo_B, 5 µM) or left untreated. Macrophages were further stimulated for 6 h with live T. borreli parasites (0.5×10⁶) or left unstimulated. mRNA levels of inducible nitric oxide synthase (iNOS) and Interleukin-1β (IL-1β) are shown relative to the house keeping gene 40S ribosomal protein S11 and are expressed as fold change relative to unstimulated cells (fold change = 1). Bars show averages ± SD of n = 4 fish. Symbol (*) shows a significant (P≤0.05) difference compared to macrophages incubated with control morpholino.

Similar articles

Cited by

References

    1. Janeway CA, Jr, Medzhitov R. Innate immune recognition. Annu Rev Immunol. 2002;20:197–216. - PubMed
    1. Cannon JP, Dishaw LJ, Haire RN, Litman RT, Ostrov DA, et al. Recognition of additional roles for immunoglobulin domains in immune function. Semin Immunol. 2010;22:17–24. - PMC - PubMed
    1. Bork P, Holm L, Sander C. The immunoglobulin fold. Structural classification, sequence patterns and common core. J Mol Biol. 1994;242:309–320. - PubMed
    1. Harpaz Y, Chothia C. Many of the immunoglobulin superfamily domains in cell adhesion molecules and surface receptors belong to a new structural set which is close to that containing variable domains. J Mol Biol. 1994;238:528–539. - PubMed
    1. Barclay AN. Ig-like domains: evolution from simple interaction molecules to sophisticated antigen recognition. Proc Natl Acad Sci U S A. 1999;96:14672–14674. - PMC - PubMed

Publication types