

Predictions of native American population structure using linguistic covariates in a hidden regression framework
- PMID: 21305006
- PMCID: PMC3031544
- DOI: 10.1371/journal.pone.0016227
Predictions of native American population structure using linguistic covariates in a hidden regression framework
Abstract
Background: The mainland of the Americas is home to a remarkable diversity of languages, and the relationships between genes and languages have attracted considerable attention in the past. Here we investigate to which extent geography and languages can predict the genetic structure of Native American populations.
Methodology/principal findings: Our approach is based on a Bayesian latent cluster regression model in which cluster membership is explained by geographic and linguistic covariates. After correcting for geographic effects, we find that the inclusion of linguistic information improves the prediction of individual membership to genetic clusters. We further compare the predictive power of Greenberg's and The Ethnologue classifications of Amerindian languages. We report that The Ethnologue classification provides a better genetic proxy than Greenberg's classification at the stock and at the group levels. Although high predictive values can be achieved from The Ethnologue classification, we nevertheless emphasize that Choco, Chibchan and Tupi linguistic families do not exhibit a univocal correspondence with genetic clusters.
Conclusions/significance: The Bayesian latent class regression model described here is efficient at predicting population genetic structure using geographic and linguistic information in Native American populations.
Conflict of interest statement
Figures


 or
or
 .
.
 correspond
to the correlations between the estimated and predicted membership
probabilities. Confidence intervals of the correlation coefficients are
estimated by assuming that the Fisher's transform
correspond
to the correlations between the estimated and predicted membership
probabilities. Confidence intervals of the correlation coefficients are
estimated by assuming that the Fisher's transform
 follows a
Gaussian distribution . The validation scores are estimated with the
2-fold cross-validation method. Their standard deviations are estimated
by using a non-parametric bootstrap method. A. The cluster memberships
are influenced by latitude but not by longitude. B. The data are
generated using latitude and a 5-level linguistic classification. C. The
data are generated in a five-island model for which
follows a
Gaussian distribution . The validation scores are estimated with the
2-fold cross-validation method. Their standard deviations are estimated
by using a non-parametric bootstrap method. A. The cluster memberships
are influenced by latitude but not by longitude. B. The data are
generated using latitude and a 5-level linguistic classification. C. The
data are generated in a five-island model for which
 .
.

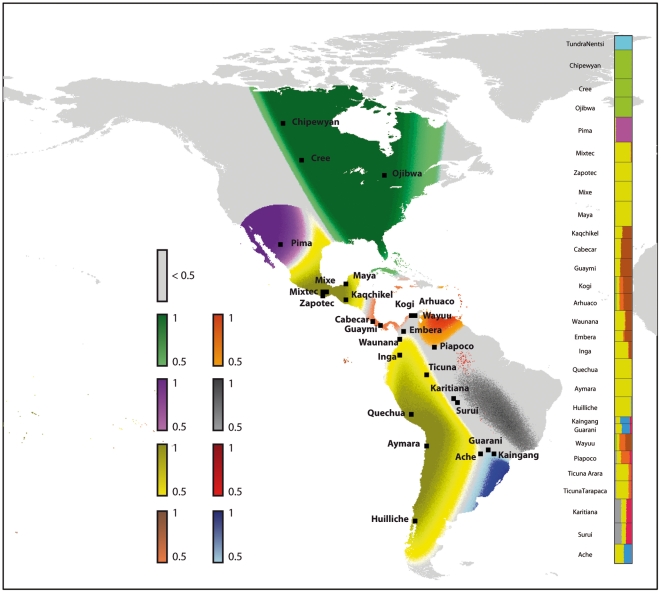
 are
colored with the cluster color. Locations for which there is no cluster
that reaches the
are
colored with the cluster color. Locations for which there is no cluster
that reaches the  threshold
or that are too distant from a sampled population are colored in grey.
The barplot displays the membership probabilities as predicted by
geographical covariates.
threshold
or that are too distant from a sampled population are colored in grey.
The barplot displays the membership probabilities as predicted by
geographical covariates.References
-
- Greenberg J, Turner CI, Zegura S. The settlement of the Americas: a comparison of the linguistic, dental, and genetic evidence. Curr Anthropol. 1986;27:477–97.
-
- Tishkoff SA, Kidd KK. Implications of biogeography of human populations for ‘race’ and medicine. Nature Genetics. 2004;36:S21–S27. - PubMed
-
- Cavalli-Sforza LL, Menozzi P, Piazza A. Princeton University Press; 1994. The History and Geography of Human Genes.
Publication types
MeSH terms
LinkOut - more resources
Full Text Sources
Molecular Biology Databases
Miscellaneous
