. 2011 Jan 28;6(1):e16499.
doi: 10.1371/journal.pone.0016499.

Novel analysis of oceanic surface water metagenomes suggests importance of polyphosphate metabolism in oligotrophic environments

Affiliations

Novel analysis of oceanic surface water metagenomes suggests importance of polyphosphate metabolism in oligotrophic environments

Ben Temperton et al. PLoS One. .

Abstract

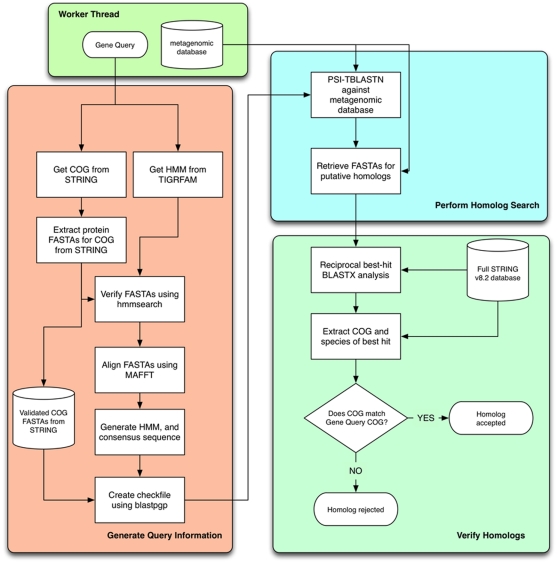
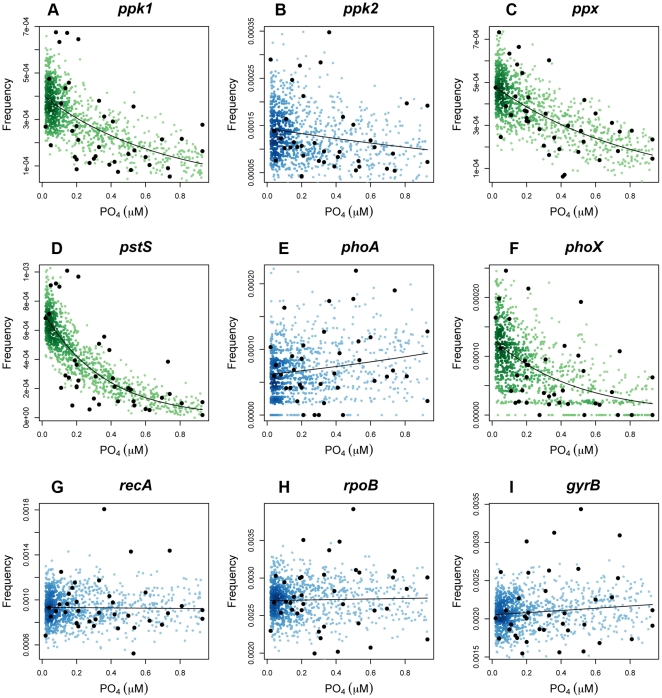
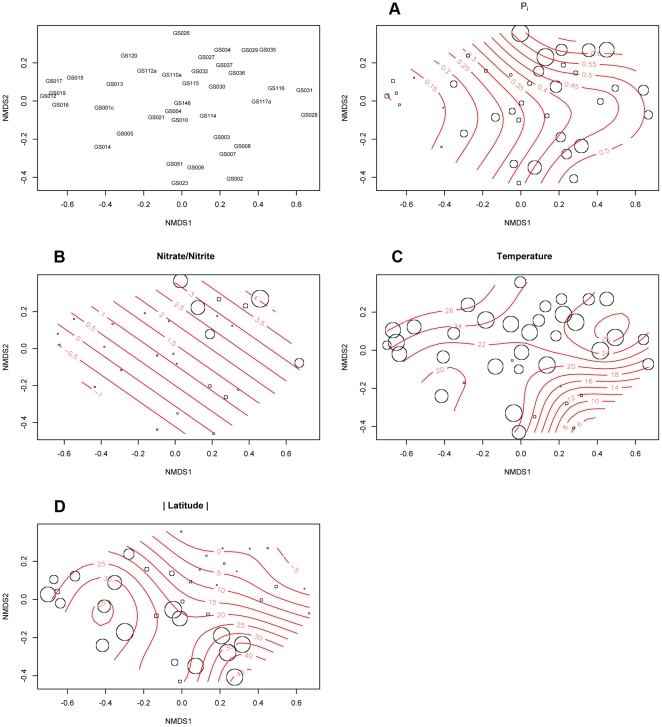
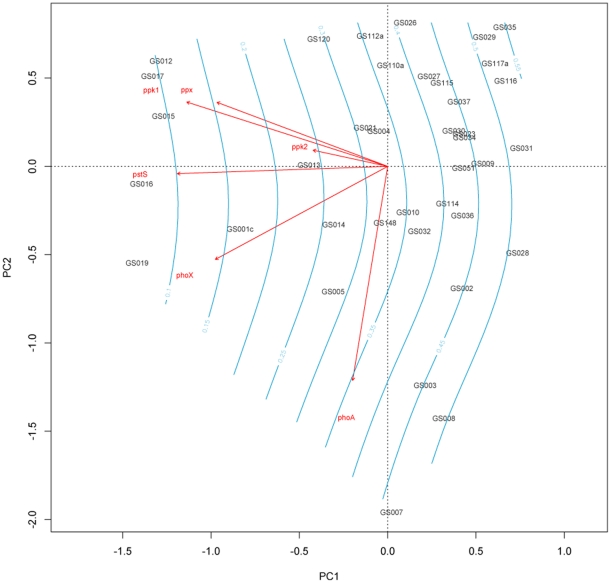
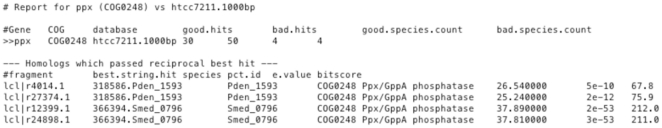
Polyphosphate is a ubiquitous linear homopolymer of phosphate residues linked by high-energy bonds similar to those found in ATP. It has been associated with many processes including pathogenicity, DNA uptake and multiple stress responses across all domains. Bacteria have also been shown to use polyphosphate as a way to store phosphate when transferred from phosphate-limited to phosphate-rich media--a process exploited in wastewater treatment and other environmental contaminant remediation. Despite this, there has, to date, been little research into the role of polyphosphate in the survival of marine bacterioplankton in oligotrophic environments. The three main proteins involved in polyphosphate metabolism, Ppk1, Ppk2 and Ppx are multi-domain and have differential inter-domain and inter-gene conservation, making unbiased analysis of relative abundance in metagenomic datasets difficult. This paper describes the development of a novel Isofunctional Homolog Annotation Tool (IHAT) to detect homologs of genes with a broad range of conservation without bias of traditional expect-value cutoffs. IHAT analysis of the Global Ocean Sampling (GOS) dataset revealed that genes associated with polyphosphate metabolism are more abundant in environments where available phosphate is limited, suggesting an important role for polyphosphate metabolism in marine oligotrophs.


Conflict of interest statement

Competing Interests: The authors have declared that no competing interests exist.

Figures

Figure 1
Figure 1. Effect of different expect-value cutoffs on the number of identified homologs in a subsampled nucleotide database from the GOS expedition, using amino acid sequences from Pseudomonas aeruginosa PAO1 as a query in a TBLASTN local alignment search.
ppk1, ppk2 and ppx are polyphosphate metabolism genes comprising of regions of both high and low conservation. recA, gyrB, and rpoB are single copy marker genes and tend to be highly conserved.
Figure 2
Figure 2. Diagrammatic representation of homolog annotation in IHAT.
A worker thread is created for each combination of gene/database to be analyzed. The three colored functional blocks represent each individual stage of the process. For each gene, generation of query information only occurs once. Output from this block is reused for all subsequent homolog searches.
Figure 3
Figure 3. Bar plots of annotation success using the pipeline, TBLASTN with Ps. aeruginosa PAO1 genes at 10−35 and 10−5 expect cutoff, and HMMER3 against an artificial dataset created from HTCC7211 random (A) 350 bp and (B) 1000 bp fragments.
For HMMER3 analysis, the artificial dataset was translated into ORFs using orf_finder and then scanned using HMMER3 using the STRING-generated HMMs as the query. Light blue bars represent the number of hits that were correctly annotated. Dark blue bars represent the number of correctly annotated hits plus the number of hits to other genes. The red dotted line indicates the total number of correct hits in the dataset, equal to the number of fragments sampled within a gene locus.
Figure 4
Figure 4. Generalized linear models of polyphosphate metabolism (A–C), high-affinity phosphate uptake (D), alkaline phosphatases (E–F) and single-copy marker gene (G–I) abundance as a function of estimated Pi concentration in GOS samples.
Frequencies (black dots) are calculated as the number of isofunctional homologs per sequence, re-scaled to Effective Sequence Counts. Models (black lines) were created using a quasipoisson distribution. Colored dots represent a simulation of 1000 samples with equal variance and distribution to measured samples, shaded according to the local density at each point. Green dots a significant difference (p-value <0.05, deviance F-test) between the model and the null model.
Figure 5
Figure 5. Non-metric Multidimensional Scaling plot of GOS sites phosphate metabolism gene abundance normalized to effective sequence counts. 2D Stress: 0.15.
(A–D) represent bubble plots of environmental variables for (A) estimated Pi concentration from World Ocean Database (WOD); (B) estimated Nitrate/Nitrite concentration from WOD; (C) Surface temperature measured at time of sampling; (D) Absolute latitude of sample sites (i.e. distance from equator). Red contour lines represent a smooth fitted surface of estimated Pi concentrations from the World Ocean Database for each site, fitted using a generalized additive model using the R function ordisurf.
Figure 6
Figure 6. Biplot of principal component analysis of phosphate metabolism gene abundance normalized to effective sequence counts in GOS sites, overlaid with a smooth fitted surface of estimated Pi concentrations from the World Ocean Database for each site (blue), fitted using a generalized additive model using the R function ordisurf.
Vector inertia is equal to correlation and scaled with optimum relation to sites. Gene sampling frequency was scaled to unit variance. PC1 explained 45% of the total correlation.
Figure 7
Figure 7. Example output from IHAT.
Each output file contains a summary header followed by a list of successfully annotated homologs, followed by a list of sequences that failed the reciprocal BLAST against the STRING database.

Similar articles

Cited by

References

    1. Benitez-Nelson CR. The biogeochemical cycling of phosphorus in marine systems. Earth-Sci Rev. 2000;51:109–135.
    1. Tyrrell T. The relative influences of nitrogen and phosphorus on oceanic primary production. Nature. 1999;400:525–531.
    1. Dyhrman ST, Ammerman JW, Van Mooy BAS. Microbes and the marine phosphorus cycle. Oceanography. 2007;20:110–116.
    1. Sebastian M, Ammerman JW. The alkaline phosphatase PhoX is more widely distributed in marine bacteria than the classical PhoA. ISME J. 2009;3:563–572. - PubMed
    1. White AE. New insights into bacterial acquisition of phosphorus in the surface ocean. Proc Natl Acad Sci U S A. 2009;106:21013–21014. - PMC - PubMed

Publication types