

Thickness profile generation for the corpus callosum using Laplace's equation
- PMID: 21305661
- PMCID: PMC6870377
- DOI: 10.1002/hbm.21174
Thickness profile generation for the corpus callosum using Laplace's equation
Abstract
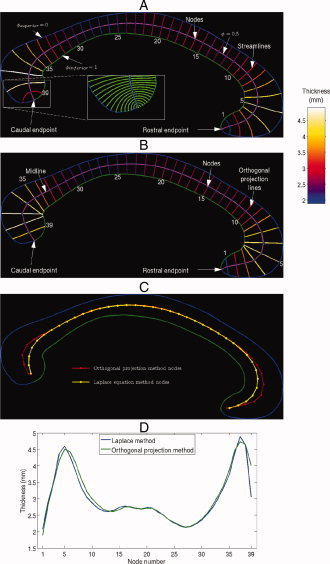
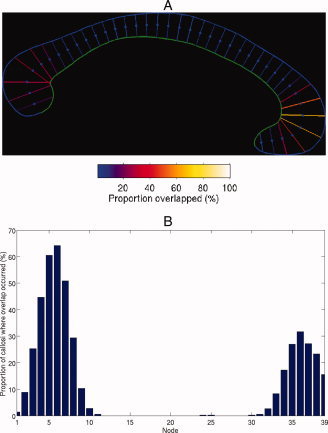
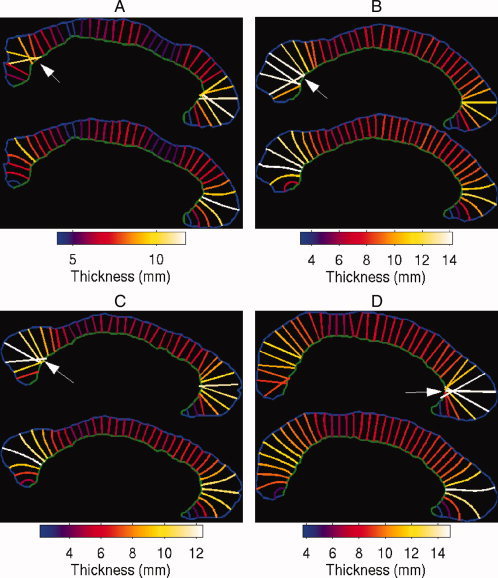
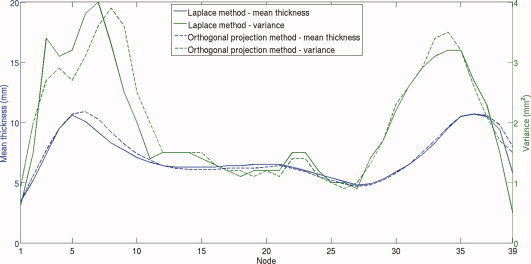
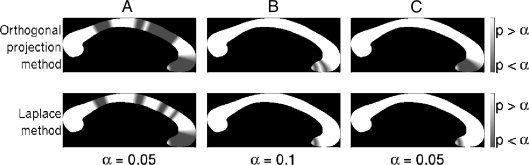
The corpus callosum facilitates communication between the cerebral hemispheres. Morphological abnormalities of the corpus callosum have been identified in numerous psychiatric and neurological disorders. To quantitatively analyze the thickness profile of the corpus callosum, we adapted an automatic thickness measurement method, which was originally used on magnetic resonance (MR) images of the cerebral cortex (Hutton et al. [2008]: NeuroImage 40:1701-10; Jones et al. [2002]: Hum Brain Mapp 11:12-32; Schmitt and Böhme [2002]: NeuroImage 16:1103-9; Yezzi and Prince [2003]: IEEE Trans Med Imaging 22:1332-9), to MR images of the corpus callosum. The thickness model was derived by computing a solution to Laplace's equation evaluated on callosal voxels. The streamlines from this solution form non-overlapping, cross-sectional contours the lengths of which are modeled as the callosal thickness. Apart from the semi-automated segmentation and endpoint selection procedures, the method is fully automated, robust, and reproducible. We compared the Laplace method with the orthogonal projection technique previously published (Walterfang et al. [2009a]: Psych Res Neuroimaging 173:77-82; Walterfang et al. [2008a]: Br J Psychiatry 192:429-34; Walterfang et al. [2008b]: Schizophr Res 103:1-10) on a cohort of 296 subjects, composed of 86 patients with chronic schizophrenia (CSZ), 110 individuals with first-episode psychosis, 100 individuals at ultra-high risk for psychosis (UHR; 27 of whom later developed psychosis, UHR-P, and 73 who did not, UHR-NP), and 55 control subjects (CTL). We report similar patterns of statistically significant differences in regional callosal thickness with respect to the comparisons CSZ vs. CTL, UHR vs. CTL, UHR-P vs. UHR-NP, and UHR vs. CTL.
Copyright © 2011 Wiley Periodicals, Inc.
Figures
References
-
- Bachmann S, Pantel J, Flender A, Bottmer C, Essig M, Schröder J ( 2003): Corpus callosum in first‐episode patients with schizophrenia—A magnetic resonance imaging study. Psychol Med 33: 1019–1027. - PubMed
-
- Barta P, Miller MI, Qiu A ( 2005): A stochastic model for studying the laminar structure of cortex from MRI. IEEE Trans Med Imaging 24: 728–742. - PubMed
-
- Beauchamp M, Anderson V, Catroppa C, Maller J, Godfrey C, Morse S, Rosenfeld J, Haritou F, Kean M ( 2009): Implications of reduced callosal area for social skills after severe traumatic brain injury in children. J Neurotrauma 26: 1645–1654. - PubMed
-
- Benjak V, Culjat M, Pavlovic M, Kostovic‐Srzentic M ( 2008): Changes of the corpus callosum in children who suffered perinatal injury of the periventricular crossroads of pathways. Coll Antropol 32: S25–S29. - PubMed
-
- Bermudez P, Zatorre R ( 2001): Sexual dimorphism in the corpus callosum: Methodological considerations in MRI morphometry. Neuroimage 13: 1121–1130. - PubMed
MeSH terms
LinkOut - more resources
Full Text Sources
Miscellaneous
