

Population pharmacokinetics of pregabalin in healthy subjects and patients with post-herpetic neuralgia or diabetic peripheral neuropathy
- PMID: 21306415
- PMCID: PMC3141187
- DOI: 10.1111/j.1365-2125.2011.03932.x
Population pharmacokinetics of pregabalin in healthy subjects and patients with post-herpetic neuralgia or diabetic peripheral neuropathy
Abstract
Aim: Pregabalin, a chemical analogue of the mammalian neurotransmitter γ-aminobutyric acid, has been approved in many countries for partial-onset seizures, generalized anxiety disorder and various other pain disorders, including neuropathic pain associated with post-herpetic neuralgia and diabetic peripheral neuropathy and fibromyalgia. The aim of this study was to develop a population pharmacokinetic model and quantify the influence of covariates on the parameters.
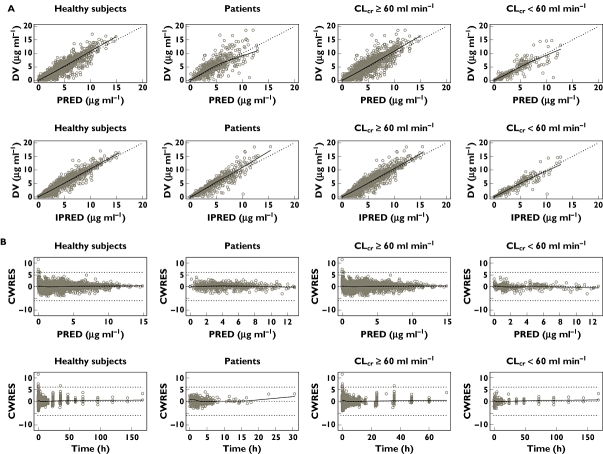
Methods: This pregabalin population pharmacokinetic analysis was conducted on data from 14 clinical trials involving healthy subjects, subjects with impaired renal function and patients with post-herpetic neuralgia or diabetic peripheral neuropathy (n= 616). The data analysis was performed using nonlinear mixed effects modelling methodology as implemented by NONMEM.
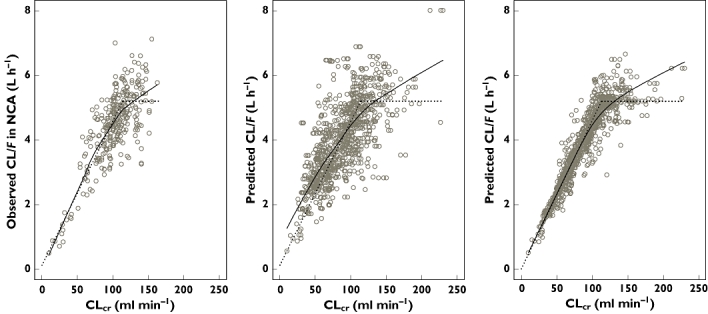
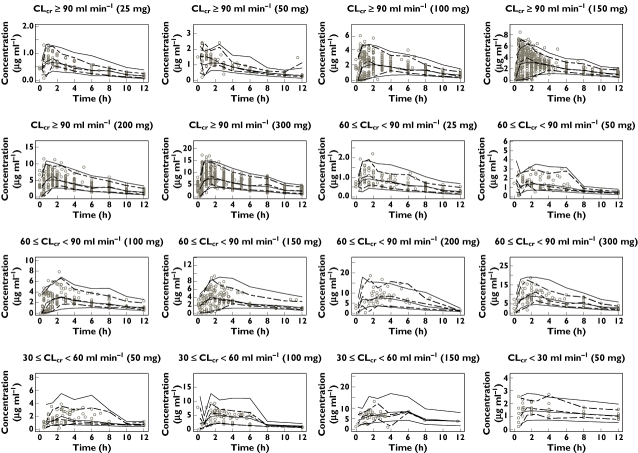
Results: A one-compartment model with first-order absorption and elimination adequately described pregabalin pharmacokinetics. The model indicated that pregabalin apparent clearance (CL/F) was proportional to estimated creatinine clearance (CL(cr) ). The pregabalin systemic exposure in patients with lower renal function who received pregabalin 150 mg twice daily was almost equal to that of patients with normal renal function administered pregabalin 300 mg twice daily. The systemic exposure stratified by lower or normal renal function was similar between patients with post-herpetic neuralgia and diabetic peripheral neuropathy.
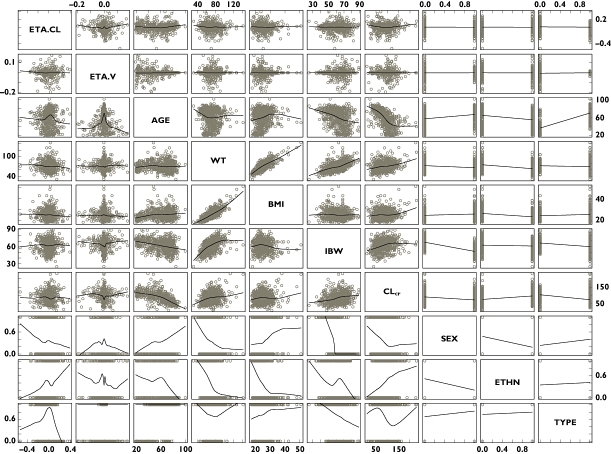
Conclusion: The developed model identified CL(cr) and ideal body weight as clinically influential covariates on CL/F and volume of distribution, respectively. This study indicates that renal function accounts for variability in the apparent clearance of pregabalin which is consistent with what is known about the elimination of this drug.
© 2011 The Authors. British Journal of Clinical Pharmacology © 2011 The British Pharmacological Society.
Figures
References
-
- Gee NS, Brown JP, Dissanayake V, Offord J, Thurlow R, Woodruff GN. The novel anticonvulsant drug, gabapentin (Neurontin), binds to the α2δ subunit of a calcium channel. J Biol Chem. 1996;271:5768–76. - PubMed
-
- Fink K, Dooley DJ, Meder WP, Cahuan NS, Duffy S, Clusmann H, Göthert M. Inhibition of neuronal Ca2+ influx by gabapentin and pregabalin in the human neocortex. Neuropharmacology. 2002;42:229–36. - PubMed
-
- Dooley DJ, Mieske CA, Borosky SA. Inhibition of K+-evoked glutamate release from rat neocortical and hippocampal slices by gabapentin. Neurosci Lett. 2000;280:107–10. - PubMed
-
- Dooley DJ, Donovan CM, Pugsley TA. Stimulus-dependent modulation of [3H] norepinephrine release from rat neocortical slices by gabapentin and pregabalin. J Pharmacol Exp Ther. 2000;295:1086–93. - PubMed
-
- Maneuf YP, Hughes J, McKnight AT. Gabapentin inhibits the substance P-facilitated K+-evoked release of [3H]glutamate from rat caudal trigeminal nucleus slices. Pain. 2001;93:191–6. - PubMed
Publication types
MeSH terms
Substances
LinkOut - more resources
Full Text Sources
Medical
