

In vivo dynamic strains of the ovine anterior mitral valve leaflet
- PMID: 21306716
- PMCID: PMC3111015
- DOI: 10.1016/j.jbiomech.2011.01.020
In vivo dynamic strains of the ovine anterior mitral valve leaflet
Abstract
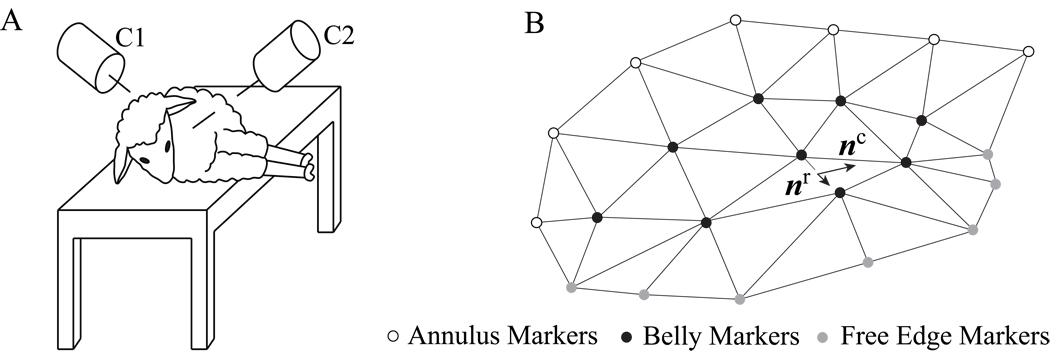
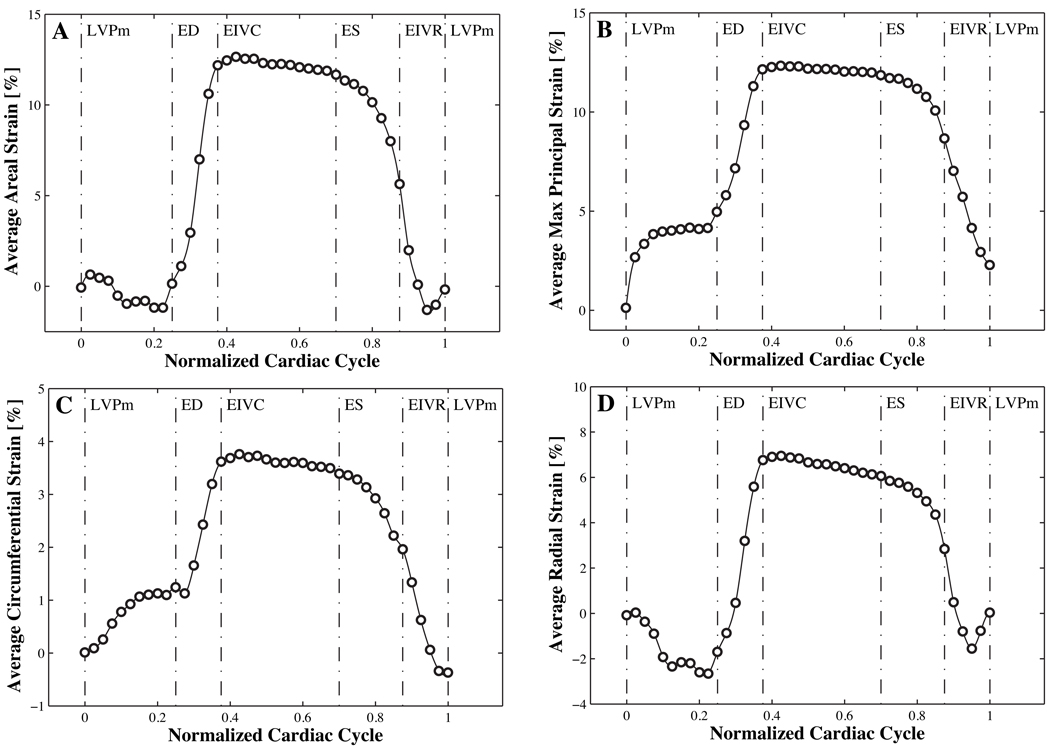
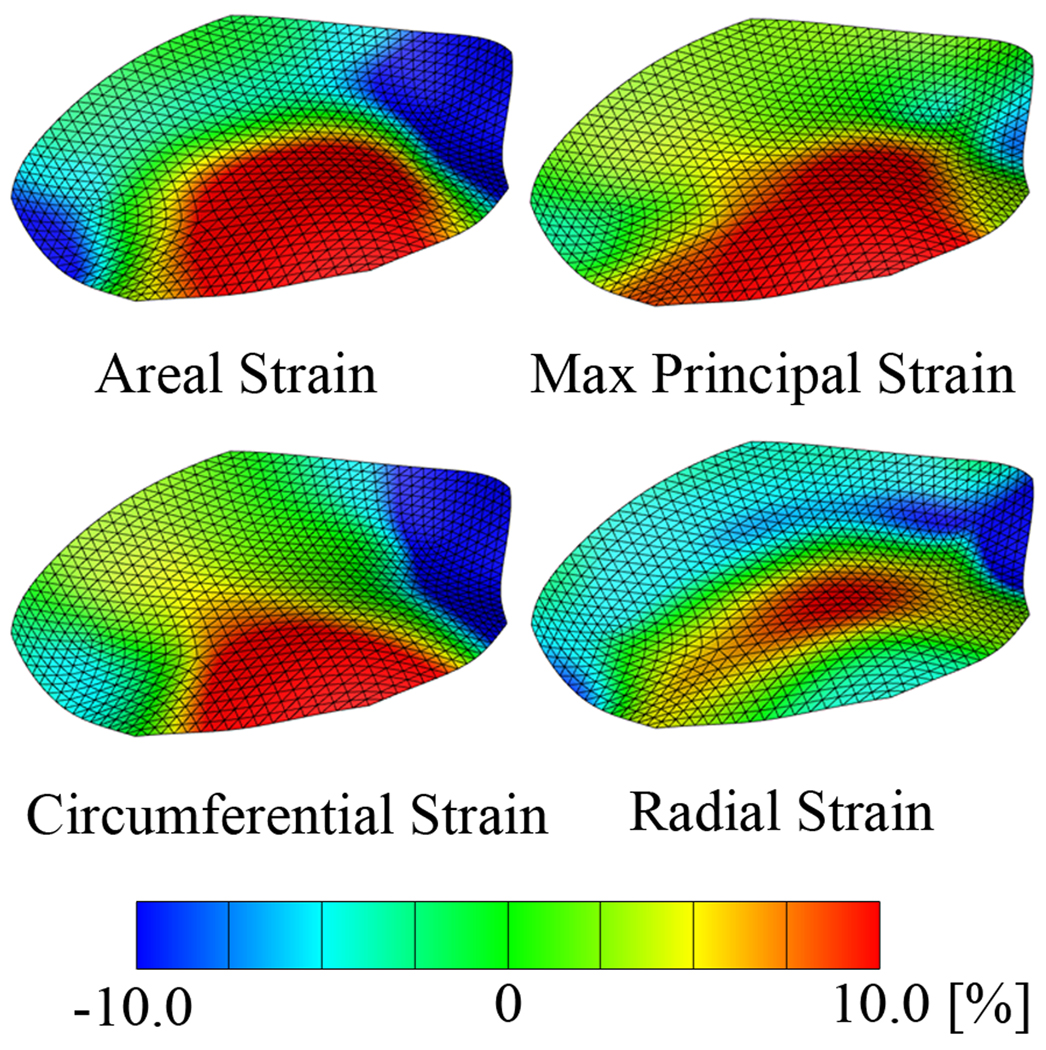
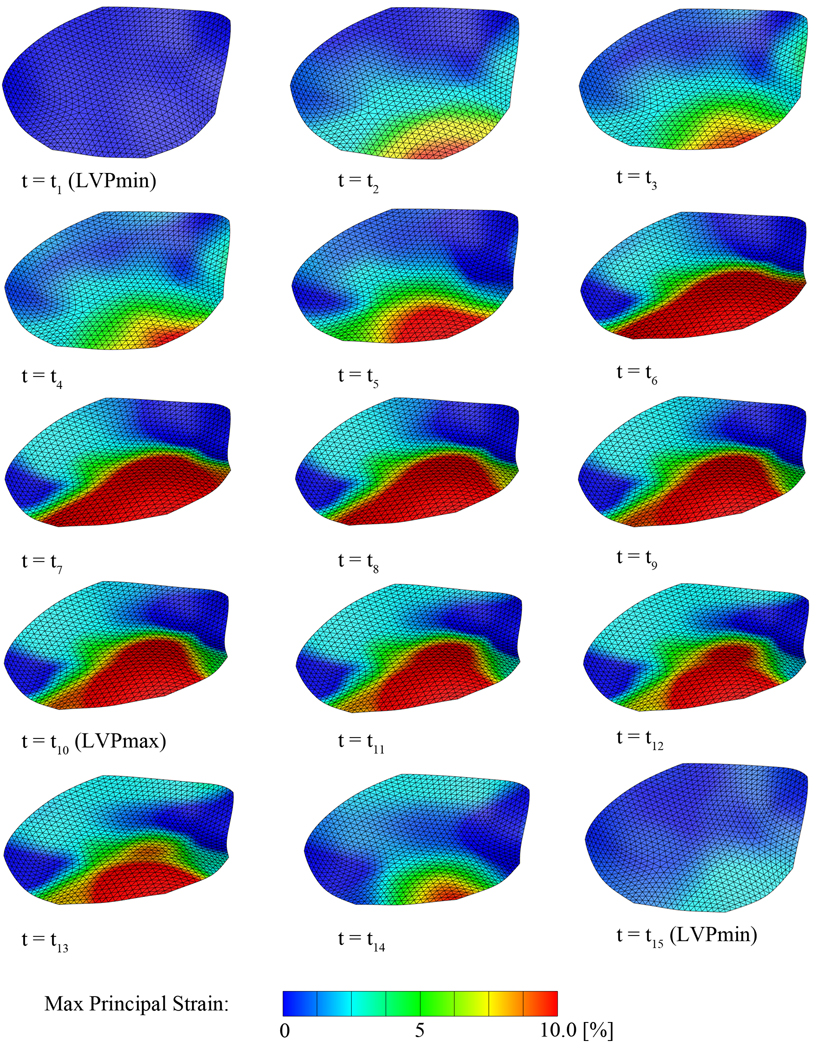
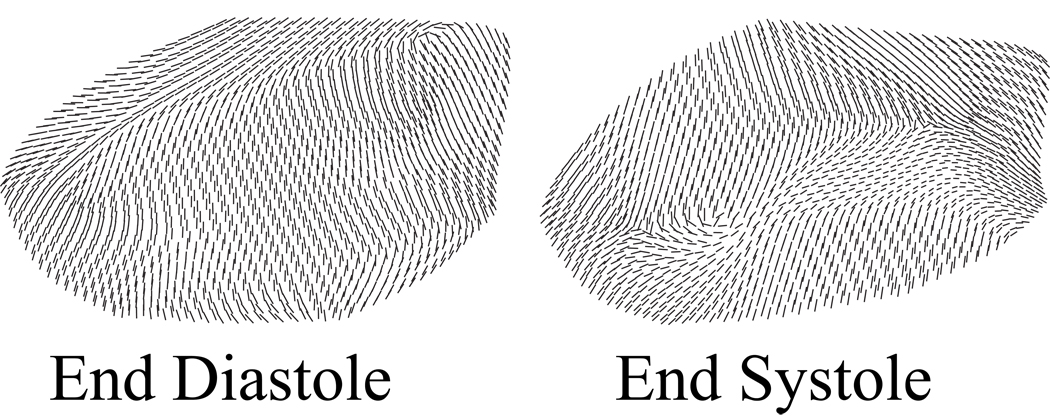
Understanding the mechanics of the mitral valve is crucial in terms of designing and evaluating medical devices and techniques for mitral valve repair. In the current study we characterize the in vivo strains of the anterior mitral valve leaflet. On cardiopulmonary bypass, we sew miniature markers onto the leaflets of 57 sheep. During the cardiac cycle, the coordinates of these markers are recorded via biplane fluoroscopy. From the resulting four-dimensional data sets, we calculate areal, maximum principal, circumferential, and radial leaflet strains and display their profiles on the averaged leaflet geometry. Average peak areal strains are 13.8±6.3%, maximum principal strains are 13.0±4.7%, circumferential strains are 5.0±2.7%, and radial strains are 7.8±4.3%. Maximum principal strains are largest in the belly region, where they are aligned with the circumferential direction during diastole switching into the radial direction during systole. Circumferential strains are concentrated at the distal portion of the belly region close to the free edge of the leaflet, while radial strains are highest in the center of the leaflet, stretching from the posterior to the anterior commissure. In summary, leaflet strains display significant temporal, regional, and directional variations with largest values inside the belly region and toward the free edge. Characterizing strain distribution profiles might be of particular clinical significance when optimizing mitral valve repair techniques in terms of forces on suture lines and on medical devices.
Copyright © 2011 Elsevier Ltd. All rights reserved.
Conflict of interest statement
All authors disclose any financial and personal relationships with other people or organizations that could inappropriately influence (bias) their work.
Figures


Similar articles
-
On the in vivo deformation of the mitral valve anterior leaflet: effects of annular geometry and referential configuration.Ann Biomed Eng. 2012 Jul;40(7):1455-67. doi: 10.1007/s10439-012-0524-5. Epub 2012 Feb 11. Ann Biomed Eng. 2012. PMID: 22327292 Free PMC article.
-
Anterior mitral leaflet curvature during the cardiac cycle in the normal ovine heart.Circulation. 2010 Oct 26;122(17):1683-9. doi: 10.1161/CIRCULATIONAHA.110.961243. Epub 2010 Oct 11. Circulation. 2010. PMID: 20937973 Free PMC article.
-
In vitro stretches of the mitral valve anterior leaflet under edge-to-edge repair condition.J Biomech Eng. 2009 Nov;131(11):111012. doi: 10.1115/1.4000111. J Biomech Eng. 2009. PMID: 20353263
-
The effects on cordal and leaflet stiffness of severe apical, posterior, and outward papillary displacement in advanced ventricular mechanism heart failure and mitral insufficiency.J Heart Valve Dis. 2011 Nov;20(6):608-18. J Heart Valve Dis. 2011. PMID: 22655489 Review.
-
Mitral valve repair for degenerative disease.J Heart Valve Dis. 2002 Jan;11 Suppl 1:S15-20. J Heart Valve Dis. 2002. PMID: 11843514 Review.
Cited by
-
The effects of a simple optical clearing protocol on the mechanics of collagenous soft tissue.J Biomech. 2021 Jun 9;122:110413. doi: 10.1016/j.jbiomech.2021.110413. Epub 2021 Apr 5. J Biomech. 2021. PMID: 33905970 Free PMC article.
-
Fully-coupled fluid-structure interaction simulation of the aortic and mitral valves in a realistic 3D left ventricle model.PLoS One. 2017 Sep 8;12(9):e0184729. doi: 10.1371/journal.pone.0184729. eCollection 2017. PLoS One. 2017. PMID: 28886196 Free PMC article.
-
Growing skin: tissue expansion in pediatric forehead reconstruction.Biomech Model Mechanobiol. 2012 Jul;11(6):855-67. doi: 10.1007/s10237-011-0357-4. Epub 2011 Nov 4. Biomech Model Mechanobiol. 2012. PMID: 22052000 Free PMC article.
-
Characterization of biomechanical properties of aged human and ovine mitral valve chordae tendineae.J Mech Behav Biomed Mater. 2016 Sep;62:607-618. doi: 10.1016/j.jmbbm.2016.05.034. Epub 2016 Jun 4. J Mech Behav Biomed Mater. 2016. PMID: 27315372 Free PMC article.
-
Kinematics of cardiac growth: in vivo characterization of growth tensors and strains.J Mech Behav Biomed Mater. 2012 Apr;8:165-77. doi: 10.1016/j.jmbbm.2011.12.006. Epub 2011 Dec 24. J Mech Behav Biomed Mater. 2012. PMID: 22402163 Free PMC article.
References
-
- Acar C, de Ibarra JS, Lansac E. Anterior leaflet augmentation with autologous pericardium for mitral repair in rheumatic valve insufficiency. Journal of Heart Valve Disease. 2004;13(5):741–746. - PubMed
-
- Betsch P, Menzel A, Stein E. On the parametrization of finite rotations in computational mechanics - A classification of concepts with application to smooth shells. Computer Methods in Applied Mechanics and Engineering. 1998;155(3–4):273–305.
-
- Billiar KL, Sacks MS. A method to quantify the fiber kinematics of planar tissues under biaxial stretch. Journal of Biomechanics. 1997;30(7):753–756. - PubMed
-
- Bonow RO, Carabello BA, Chatterjee K, de Leon AC, Faxon DP, Freed MD, Gaasch WH, Lytle BW, Nishimura RA, O’Gara PT, O’Rourke RA, Otto CM, Shah PM, Shanewise JS. 2008 focused update incorporated into the ACC/AHA 2006 guidelines for the management of patients with valvular heart disease. Journal of the American College of Cardiology. 2008;52(13):e1–e142. - PubMed
Publication types
MeSH terms
Grants and funding
LinkOut - more resources
Full Text Sources
