

Estimation of musculoskeletal models from in situ measurements of muscle action in the rat hindlimb
- PMID: 21307059
- PMCID: PMC3036547
- DOI: 10.1242/jeb.049163
Estimation of musculoskeletal models from in situ measurements of muscle action in the rat hindlimb
Abstract
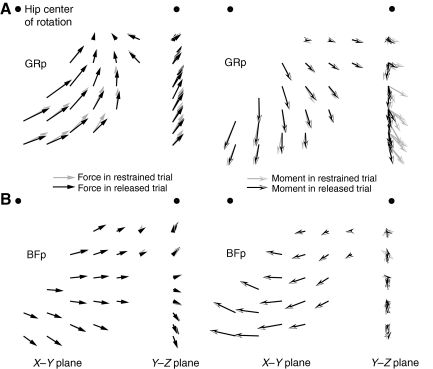
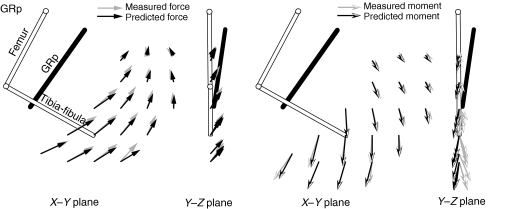
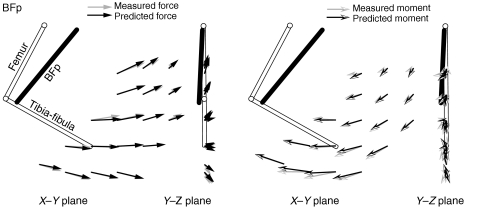
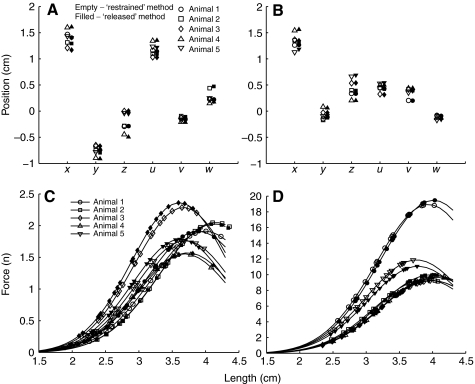
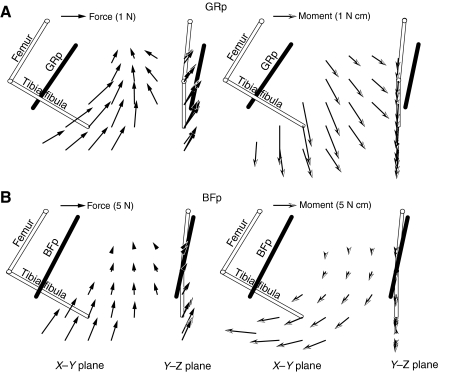
Musculoskeletal models are often created by making detailed anatomical measurements of muscle properties. These measurements can then be used to determine the parameters of canonical models of muscle action. We describe here a complementary approach for developing and validating muscle models, using in situ measurements of muscle actions. We characterized the actions of two rat hindlimb muscles: the gracilis posticus (GRp) and the posterior head of biceps femoris (BFp; excluding the anterior head with vertebral origin). The GRp is a relatively simple muscle, with a circumscribed origin and insertion. The BFp is more complex, with an insertion distributed along the tibia. We measured the six-dimensional isometric forces and moments at the ankle evoked from stimulating each muscle at a range of limb configurations. The variation of forces and moments across the workspace provides a succinct characterization of muscle action. We then used this data to create a simple muscle model with a single point insertion and origin. The model parameters were optimized to best explain the observed force-moment data. This model explained the relatively simple muscle, GRp, very well (R(2)>0.85). Surprisingly, this simple model was also able to explain the action of the BFp, despite its greater complexity (R(2)>0.84). We then compared the actions observed here with those predicted using recently published anatomical measurements. Although the forces and moments predicted for the GRp were very similar to those observed here, the predictions for the BFp differed. These results show the potential utility of the approach described here for the development and refinement of musculoskeletal models based on in situ measurements of muscle actions.
Figures
Similar articles
-
Transducer and base compliance alter the in situ 6 dof force measured from muscle during an isometric contraction in a multi-joint limb.J Biomech. 2012 Apr 5;45(6):1017-22. doi: 10.1016/j.jbiomech.2012.01.005. Epub 2012 Feb 2. J Biomech. 2012. PMID: 22304843 Free PMC article.
-
Uncertainty in Limb Configuration Makes Minimal Contribution to Errors Between Observed and Predicted Forces in a Musculoskeletal Model of the Rat Hindlimb.IEEE Trans Biomed Eng. 2018 Feb;65(2):469-476. doi: 10.1109/TBME.2017.2775598. IEEE Trans Biomed Eng. 2018. PMID: 29346113 Free PMC article.
-
Specificity of intramuscular activation during rhythms produced by spinal patterning systems in the in vitro neonatal rat with hindlimb attached preparation.J Neurophysiol. 2010 Oct;104(4):2158-68. doi: 10.1152/jn.00477.2010. Epub 2010 Jul 21. J Neurophysiol. 2010. PMID: 20660414 Free PMC article.
-
Understanding complex muscles in the rat hindlimb: Activations and actions.Annu Int Conf IEEE Eng Med Biol Soc. 2010;2010:4502-5. doi: 10.1109/IEMBS.2010.5626054. Annu Int Conf IEEE Eng Med Biol Soc. 2010. PMID: 21095781
-
Muscle moment arms and sensitivity analysis of a mouse hindlimb musculoskeletal model.J Anat. 2016 Oct;229(4):514-35. doi: 10.1111/joa.12461. Epub 2016 May 12. J Anat. 2016. PMID: 27173448 Free PMC article.
Cited by
-
Transducer and base compliance alter the in situ 6 dof force measured from muscle during an isometric contraction in a multi-joint limb.J Biomech. 2012 Apr 5;45(6):1017-22. doi: 10.1016/j.jbiomech.2012.01.005. Epub 2012 Feb 2. J Biomech. 2012. PMID: 22304843 Free PMC article.
-
Three-dimensional ankle moments and nonlinear summation of rat triceps surae muscles.PLoS One. 2014 Oct 31;9(10):e111595. doi: 10.1371/journal.pone.0111595. eCollection 2014. PLoS One. 2014. PMID: 25360524 Free PMC article.
-
Analyzing Modeled Torque Profiles to Understand Scale-Dependent Active Muscle Responses in the Hip Joint.Biomimetics (Basel). 2022 Jan 20;7(1):17. doi: 10.3390/biomimetics7010017. Biomimetics (Basel). 2022. PMID: 35225910 Free PMC article.
-
Bridging the gap between cadaveric and in vivo experiments: a biomechanical model evaluating thumb-tip endpoint forces.J Biomech. 2013 Mar 15;46(5):1014-20. doi: 10.1016/j.jbiomech.2012.10.044. Epub 2013 Jan 16. J Biomech. 2013. PMID: 23332233 Free PMC article.
-
Uncertainty in Limb Configuration Makes Minimal Contribution to Errors Between Observed and Predicted Forces in a Musculoskeletal Model of the Rat Hindlimb.IEEE Trans Biomed Eng. 2018 Feb;65(2):469-476. doi: 10.1109/TBME.2017.2775598. IEEE Trans Biomed Eng. 2018. PMID: 29346113 Free PMC article.
References
-
- Brown I. E., Loeb G. E. (2000). A reductionist approach to creating and using neuromusculoskeletal models. In Biomechanics and Neural Control of Posture and Movement (ed. Winters J. M., Crago P. E.), pp. 148-163 New York: Springer-Verlag;
-
- Carrasco D., English A. (1999). Mechanical actions of compartments of the cat hamstring muscle, biceps femoris. Prog. Brain Res. 123, 397-403 - PubMed
-
- Chanaud C., Macpherson J. (1991). Functionally complex muscles of the cat hindlimb. III. Differential activation within biceps femoris during postural perturbations. Exp. Brain Res. 85, 271-280 - PubMed
Publication types
MeSH terms
Grants and funding
LinkOut - more resources
Full Text Sources
