. 2011 May;85(9):4143-56.
doi: 10.1128/JVI.02606-10. Epub 2011 Feb 9.

A Rab11- and microtubule-dependent mechanism for cytoplasmic transport of influenza A virus viral RNA

Affiliations

A Rab11- and microtubule-dependent mechanism for cytoplasmic transport of influenza A virus viral RNA

Maria Joao Amorim et al. J Virol. 2011 May.

Abstract

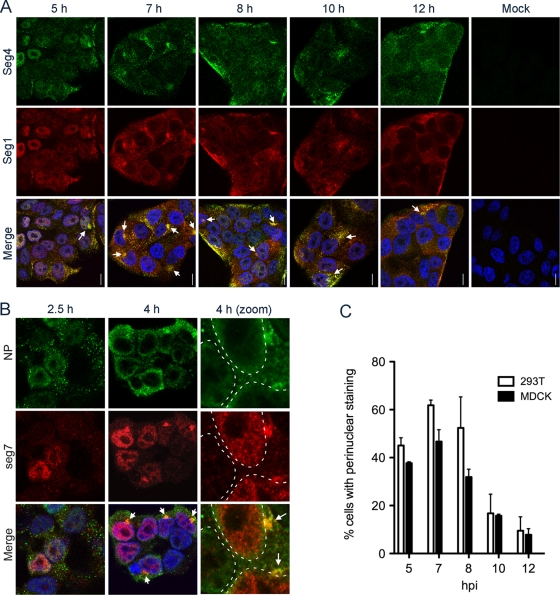
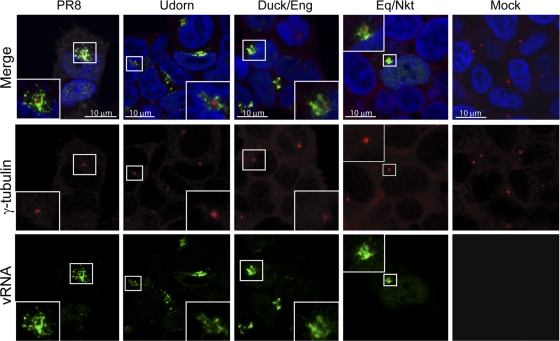
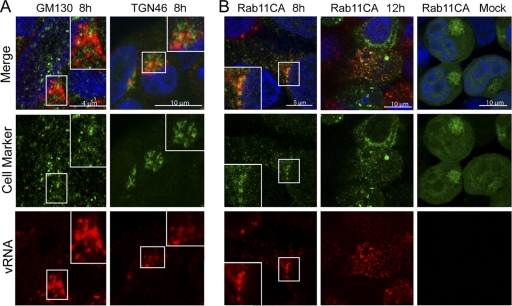
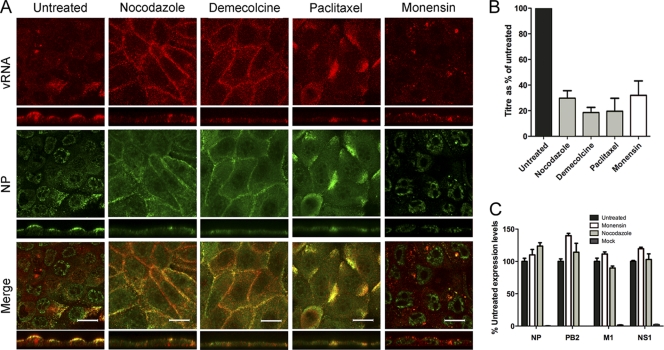
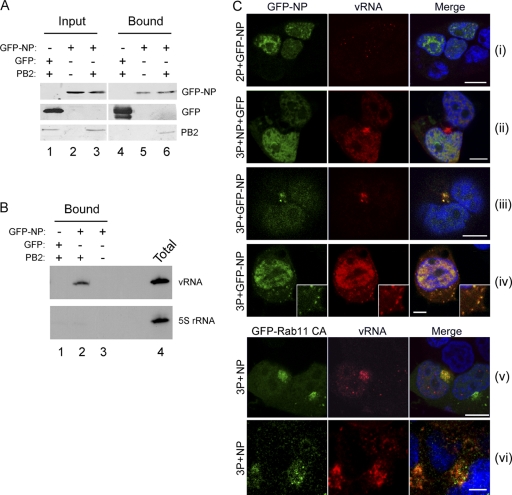
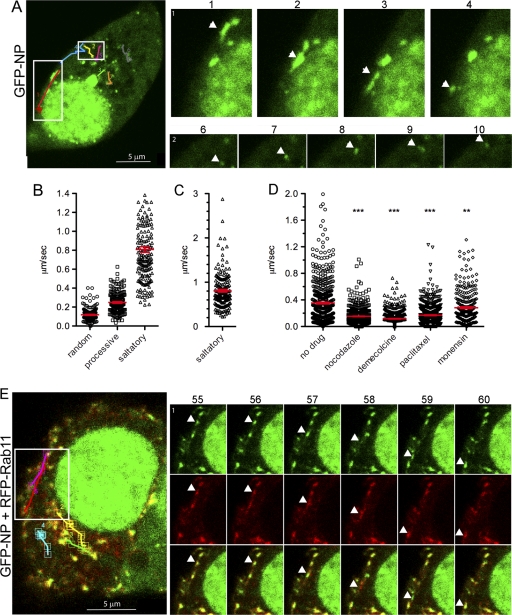
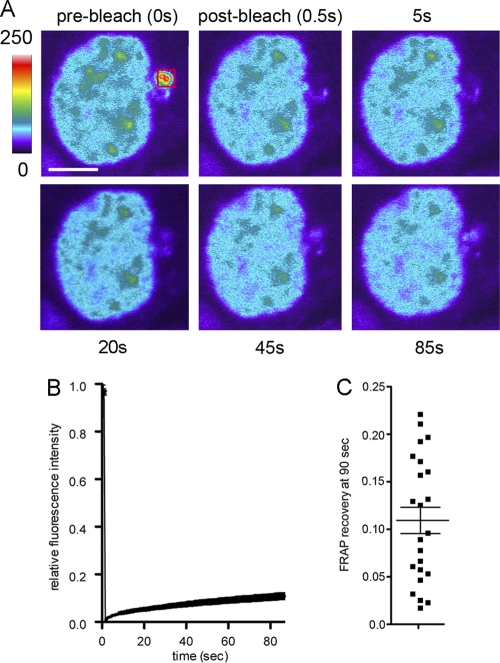
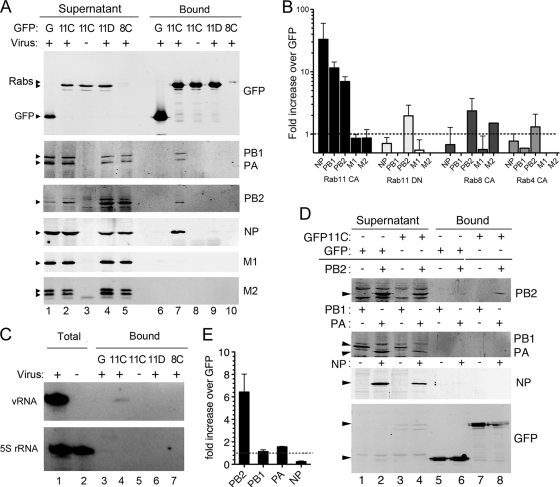
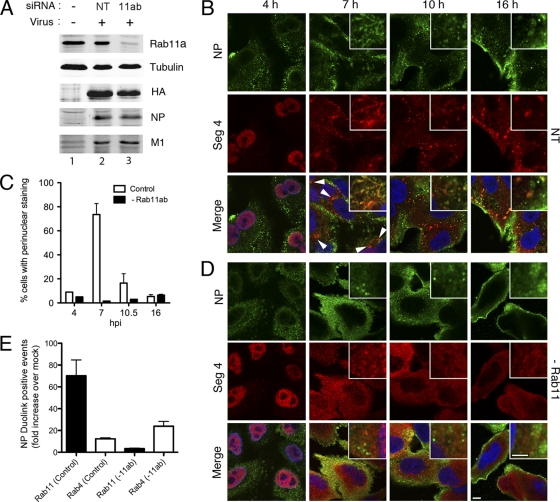
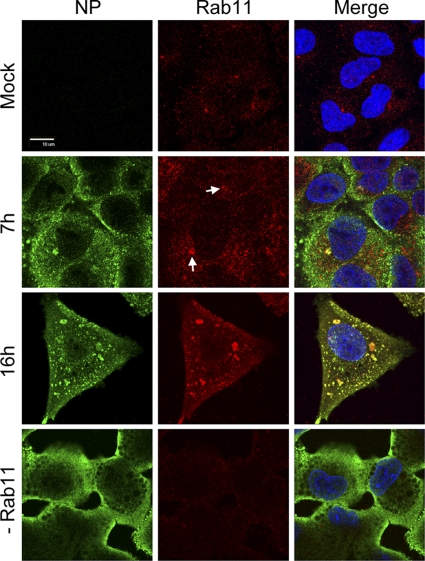
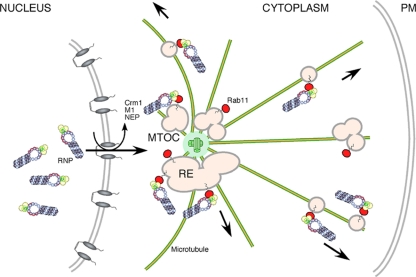
The viral RNA (vRNA) genome of influenza A virus is replicated in the nucleus, exported to the cytoplasm as ribonucleoproteins (RNPs), and trafficked to the plasma membrane through uncertain means. Using fluorescent in situ hybridization to detect vRNA as well as the live cell imaging of fluorescently labeled RNPs, we show that an early event in vRNA cytoplasmic trafficking involves accumulation near the microtubule organizing center in multiple cell types and viral strains. Here, RNPs colocalized with Rab11, a pericentriolar recycling endosome marker. Cytoplasmic RNP localization was perturbed by inhibitors of vesicular trafficking, microtubules, or the short interfering RNA-mediated depletion of Rab11. Green fluorescent protein (GFP)-tagged RNPs in living cells demonstrated rapid, bidirectional, and saltatory movement, which is characteristic of microtubule-based transport, and also cotrafficked with fluorescent Rab11. Coprecipitation experiments showed an interaction between RNPs and the GTP-bound form of Rab11, potentially mediated via the PB2 subunit of the polymerase. We propose that influenza virus RNPs are routed from the nucleus to the pericentriolar recycling endosome (RE), where they access a Rab11-dependent vesicular transport pathway to the cell periphery.


Figures

Fig. 1.
Fig. 1.
Time course of vRNA localization in infected cells shows the perinuclear accumulation of vRNA at intermediate times postinfection. MDCK (A) or 293T (B) cells were infected (or mock infected) with PR8 virus and fixed and stained for specific vRNA segments (A) and both vRNA segments and NP (B) at the indicated times p.i. Merged images also include 4′,6′-diamidino-2-phenylindole (DAPI) staining (blue) except in the higher-magnification images in panel B, where for clarity the outline of the DAPI staining is indicated by dashed white lines. (C) The percentage (means ± SE) of cells showing an obvious perinuclear accumulation of vRNA was scored at various times p.i. A minimum of 200 cells from three independent experiments were counted. Also see Movie S1 in the supplemental material.
Fig. 2.
Fig. 2.
Perinuclear accumulation of vRNA is a general feature of influenza A viruses. 293T cells were infected (or mock infected) with the indicated viruses, fixed at 6 h p.i., and stained for segment 7 vRNA and γ-tubulin. Merged images include a 4′,6′-diamidino-2-phenylindole (DAPI) channel shown in blue. Insets show higher-magnification images of the boxed areas.
Fig. 3.
Fig. 3.
Relationship of the perinuclear accumulation of vRNA to cellular structures. (A and B) 293T cells were infected with PR8 virus, fixed at the times shown, and stained for segment 7 vRNA (A) and the indicated cellular polypeptides. (B) The cells first were transfected with GFP-Rab11 CA, which was detected by GFP fluorescence. Merged images include a 4′,6′-diamidino-2-phenylindole (DAPI) channel shown in blue. Insets show higher-magnification images of the boxed areas.
Fig. 4.
Fig. 4.
Effect of inhibitors of cellular trafficking on RNP localization. MDCK cells were infected with PR8 virus and at 90 min p.i. were treated with the indicated drugs or left untreated. (A) At 8 h p.i. (or 6.5 h p.i. for monensin) the cells were fixed and processed for FISH to detect segment 2 vRNA (red) and counterstained for NP protein (green). Small panels show z axis reconstructions. The scale bar indicates 16 μm. (B) Titers of supernatants were determined by plaque assay, and the results were plotted as the mean percentage ± SEM (n ≥ 3) of the value from untreated cells. (C) Cell lysates were analyzed by SDS-PAGE and Western blotting, followed by densitometry for the indicated viral proteins. The means and ranges from two independent experiments are plotted.
Fig. 5.
Fig. 5.
Reconstitution of cytoplasmic RNP trafficking with GFP-tagged components. 293T cells were transfected with plasmids expressing segment 7 and 8 vRNAs and the minimal protein components of an influenza RNP, the three polymerase proteins (3P; or, as a nonfunctional control, two polymerase proteins lacking PB2 [2P]) and NP, as well as with plasmids expressing GFP-NP, GFP-Rab11 CA, or GFP as labeled. (A) At 48 h posttransfection, cells were lysed and analyzed by Western blotting for GFP and PB2 before (input) or after (bound) GFP-Trap affinity selection. (B) Bound RNA was analyzed by primer extension for segment 7 (vRNA) or 5S rRNA. A sample of infected cell RNA was analyzed in parallel as a marker (total). (C) At 24 h posttransfection, cells were fixed and stained for segment 7 vRNA by FISH. Nuclei were stained with 4′,6′-diamidino-2-phenylindole (DAPI). Scale bar, 5 μm.
Fig. 6.
Fig. 6.
Live-cell trafficking of GFP-NP and RFP-Rab11. 293T cells were transfected with plasmids to reconstitute viral RNPs containing segments 7 and 8 plus either GFP-NP (A to D) or GFP-NP and RFP-Rab11 (E) before imaging under time-lapse conditions (approximately every 4 s) at 24 h posttransfection. (A and E) Single images at time zero are shown in the large panels with the tracks of selected particles indicated, while individual frames with single moving particles highlighted with arrowheads are shown in the small panels. For example, track 1 shows saltatory class movement followed by Brownian-type movement, and track 2 is classified as processive-type movement. Note that in panel E the apparent spatial separation of red and green images of fast-moving particles is likely to be an artifact resulting from the time taken for the microscope to switch between channels. (B to D) Particle speeds were measured between consecutive frames of time-lapse movies using ImageJ. Each data point represents one measurement between consecutive frames. (B and C) Values from untreated cells were grouped according to whether the particles demonstrated nondirectional Brownian-type motion (random), steady processive motion, or saltatory/bidirectional motion during the course of individual movies. A partial data set of saltatory movement, excluding a small number of very fast moving particles, is plotted in panel B to avoid the visual compression of the lower-value data points, while the full data set is plotted separately in panel C. A total of 98 particles from 16 cells from 10 independent transfections were analyzed. (D) Values from cells treated with the indicated drugs or left untreated (pooled data from panel B) are plotted. A minimum of 54 particles from between 7 and 16 cells from two to three independent experiments were analyzed, focusing on the fastest moving particles within the cells. Red bars indicate the means ± SEM. Asterisks indicate the outcome of statistical tests (nonparametric, two-tailed Mann-Whitney t test) for differences between the treated and untreated samples. ***, P < 0.001; **, P < 0.01. Also see Movies S2 to 4 and 6 in the supplemental material.
Fig. 7.
Fig. 7.
FRAP analysis of the perinuclear compartment. RNPs were reconstituted in 293T cells as described in the legend to Fig. 5, and perinuclear areas of fluorescence were subjected to FRAP analysis. (A) Representative images from one cell (colored according to fluorescence intensity in arbitrary units) are shown. The scale bar is 5 μm, and the red square denotes the bleach area. (B) The mean ± SEM (n = 24) recovery curve is plotted. (C) The fraction of initial fluorescence recovered at 85 s after the bleaching of individual cells is plotted. Horizontal lines indicate the means ± SEM. Also see Movie S5 in the supplemental material.
Fig. 8.
Fig. 8.
Biochemical association of RNPs and Rab11. (A to C) 293T cells were transfected with plasmids expressing GFP alone or the indicated GFP-Rab proteins (11C, Rab11 CA; 11D, Rab11 DN; 8C, Rab8 CA) and infected (or mock infected) 48 h later with PR8 virus. (A) Cell lysates prepared at 6 h p.i. were analyzed by Western blotting for the indicated polypeptides after GFP-Trap affinity selection into supernatant and bound fractions. Sample loading is such that the supernatants are equivalent to 1/10 the bound fractions. (B) Bound protein was quantified from replicate experiments and is plotted as the mean ± SEM fold increase relative to levels for the GFP control. (C) RNA was analyzed by primer extension for segment 7 vRNA and 5S rRNA before (total) or after GFP-TRAP selection. (D and E) 293T cells were transfected with the indicated plasmids and analyzed by GFP-TRAP affinity selection followed by Western blotting as for panels A and B.
Fig. 9.
Fig. 9.
Effect of siRNA depletion of Rab11 on RNP localization. A549 cells were transfected or mock transfected (−) with siRNAs against Rab11a and Rab11b (Rab11) or with a nontargeting control (NT) and infected or mock infected 3 days later with PR8 virus as indicated. (A) At 16 h p.i., cell lysates were analyzed by Western blotting for the indicated proteins. (B to D) A549 cells were treated with nontargeting (NT) or (D) with siRNAs against Rab11a and Rab11b, infected 3 days later with PR8 virus, fixed at the indicated times p.i., and stained for segment 4 vRNA and NP. Merged-image panels also show 4′,6′-diamidino-2-phenylindole (DAPI) staining for nuclei. All images were collected at equal microscope settings, but the 4-h panels are shown at increased brightness. Scale bars, 5 μm. (C) The percentage (means ± SE) of cells showing an obvious perinuclear accumulation of vRNA was scored at various times p.i. (E) Cells were fixed and analyzed for NP proximity to the indicated Rab proteins by a Duolink PLA fluorescence proximity assay. The number of fluorescent spots per nuclei (>360 cells) of single optical sections were counted and are presented as the mean ± SEM (n = 2 to 3 independent experiments) increase above levels for similarly stained mock-infected cells.
Fig. 10.
Fig. 10.
Colocalization of Rab11 and NP in A549 cells. Cells were infected or mock infected with PR8 virus, fixed at 16 h p.i., and stained for NP and Rab11. Scale bar, 10 μm.
Fig. 11.
Fig. 11.
Cartoon model for influenza virus RNP trafficking. RNPs are replicated within the nucleus and exported via cellular Crm1 and viral NEP and M1 proteins. They initially concentrate at the pericentriolar recycling endosome (RE) adjacent to the microtubule organizing center (MTOC) through interactions with Rab11. Subsequently, they traffic along the microtubule network toward the cell periphery and plasma membrane (PM) on Rab11-positive cargo vesicles.

References

    1. Afonso P. V., Zamborlini A., Saib A., Mahieux R. 2007. Centrosome and retroviruses: the dangerous liaisons. Retrovirology 4:27. - PMC - PubMed
    1. Amorim M. J., Read E. K., Dalton R. M., Medcalf L., Digard P. 2007. Nuclear export of influenza A virus mRNAs requires ongoing RNA polymerase II activity. Traffic 8:1–11 - PubMed
    1. Apodaca G., Katz L. A., Mostov K. E. 1994. Receptor-mediated transcytosis of IgA in MDCK cells is via apical recycling endosomes. J. Cell Biol. 125:67–86 - PMC - PubMed
    1. Arcangeletti M. C., et al. 1997. Modification of cytoskeleton and prosome networks in relation to protein synthesis in influenza A virus-infected LLC-MK2 cells. Virus Res. 51:19–34 - PubMed
    1. Avalos R. T., Yu Z., Nayak D. P. 1997. Association of influenza virus NP and M1 proteins with cellular cytoskeletal elements in influenza virus-infected cells. J. Virol. 71:2947–2958 - PMC - PubMed

Publication types