. 2011 May;85(9):4184-97.
doi: 10.1128/JVI.02290-10. Epub 2011 Feb 9.

The role of LAT in increased CD8+ T cell exhaustion in trigeminal ganglia of mice latently infected with herpes simplex virus 1

Affiliations

The role of LAT in increased CD8+ T cell exhaustion in trigeminal ganglia of mice latently infected with herpes simplex virus 1

Sariah J Allen et al. J Virol. 2011 May.

Abstract

Herpes simplex virus (HSV) infection is a classic example of latent viral infection in humans and experimental animal models. The HSV-1 latency-associated transcript (LAT) plays a major role in the HSV-1 latency reactivation cycle and thus in recurrent disease. Whether the presence of LAT leads to generation of dysfunctional T cell responses in the trigeminal ganglia (TG) of latently infected mice is not known. To address this issue, we used LAT-positive [LAT(+)] and LAT-deficient [LAT(-)] viruses to evaluate the effect of LAT on CD8 T cell exhaustion in TG of latently infected mice. The amount of latency as determined by quantitative reverse transcription-PCR (qRT-PCR) of viral DNA in total TG extracts was 3-fold higher with LAT(+) than with LAT(-) virus. LAT expression and increased latency correlated with increased mRNA levels of CD8, PD-1, and Tim-3. PD-1 is both a marker for exhaustion and a primary factor leading to exhaustion, and Tim-3 can also contribute to exhaustion. These results suggested that LAT(+) TG contain both more CD8(+) T cells and more CD8(+) T cells expressing the exhaustion markers PD-1 and Tim-3. This was confirmed by flow cytometry analyses of expression of CD3/CD8/PD-1/Tim-3, HSV-1, CD8(+) T cell pentamer (specific for a peptide derived from residues 498 to 505 of glycoprotein B [gB(498-505)]), interleukin-2 (IL-2), and tumor necrosis factor alpha (TNF-α). The functional significance of PD-1 and its ligands in HSV-1 latency was demonstrated by the significantly reduced amount of HSV-1 latency in PD-1- and PD-L1-deficient mice. Together, these results may suggest that both PD-1 and Tim-3 are mediators of CD8(+) T cell exhaustion and latency in HSV-1 infection.


Figures

Fig. 1.
Fig. 1.
Quantitation of viral DNA in TG of latently infected mice. C57BL/6 mice were ocularly infected with HSV-1 strain McKrae [LAT(+)[, dLAT2903 [LAT(−)A], HSV-gK3 [LAT(−)B], which expresses two additional copies of gK in place of LAT, and HSV-CD80 [LAT(−)C], which expresses two copies of CD80 in place of LAT. On day 30 p.i., TG were harvested from the latently infected surviving mice. Quantitative PCR was performed on each individual mouse TG. In each experiment, an estimated relative copy number of the HSV-1 gB gene was calculated using standard curves generated from pGem-gB1. Briefly, DNA template was serially diluted 10-fold such that 5 μl contained from 103 to 1011 copies of gB DNA, and then the sample was subjected to TaqMan PCR with the same set of primers. By comparing the normalized threshold cycle of each sample to the threshold cycle of the standard, the copy number for each reaction was determined. GAPDH expression was used to normalize the relative expression of viral (gB) DNA in the TG. Each point represents the mean ± standard error of the mean from 56 TG for LAT(+) and LAT(−)A viruses and 20 TG each for LAT(−)B and LAT(−)C viruses.
Fig. 2.
Fig. 2.
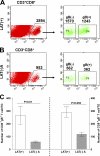
Detection of CD8+ PD-1+ and CD8+ Tim-3+ T cells in TG of latently infected mice. C57BL/6 mice were infected in both eyes with 2 × 10⁵ PFU/eye of LAT(+) or LAT(−)A virus. Naive mice were used as controls. At 30 days p.i., TG from five mice per group were harvested and digested with collagenase (400 IU/TG). The cell suspension was filtered through a 45-mm-pore-size cell strainer followed by a magnetic cell sorting (MACS) T cell isolation column and then stained with Pacific Blue-anti-CD8, FITC-anti-PD-1, and APC-anti-Tim-3 and analyzed by flow cytometry. Positive cells numbers are indicated in upper right corners of panels. (A) Representative histograms of CD3+ CD8+ T cells that are Tim-3 positive (left) or PD-1 positive (right) infected with LAT(+) virus from five pooled TG per group from four independent experiments. (B) Representative histograms of CD3+ CD8+ T cells that are Tim-3 positive (left) or PD-1 positive (right) infected with LAT(−)A virus from five pooled TG per group from four independent experiments. (C) Quantification of the mean number of CD8+ Tim-3+ (right) and CD8+ PD-1+ (left) T cells per individual TG in LAT(+) and LAT(−)A virus. The experiment was repeated four times for a total of 40 TG (20 mice/group), and values are means ± standard error of the means. (D) Representative histogram and dot blot for CD3+ CD4+ and CD3+ CD8+ T cells from the TG and spleen of naive mice.
Fig. 3.
Fig. 3.
Immunohistochemistry and quantification of CD8+ T cell exhaustion markers in TG of latently infected mice. TG from 12 C57BL/6 mice latently infected with LAT(+) or LAT(−)A virus and 5 naive mice were isolated and stained with CD8, PD-1, and Tim-3 antibodies as described in Materials and Methods. (A) Representative photomicrographs of CD8+ (Alexa Fluor-564; red) and PD-1+ (Alexa Fluor-488; green) T cells in the TG of naïve mice and mice latently infected with LAT(+) and LAT(−) viruses. DAPI is shown as a nuclear counterstain. Arrows denote CD8+ PD-1+ T cells. (B) Representative photomicrographs of CD8+ (Alexa Fluor-488; green) and Tim-3+ (Alexa Fluor-647; red) T cells in the TG of naïve mice and mice latently infected with LAT(+) and LAT(−) viruses. DAPI is shown as a nuclear counterstain. Arrows denote CD8+ Tim-3+ T cells. (C) Quantification of photomicrographs. Different areas of each TG were imaged, and the number of double-positive cells was counted. Each point represents the mean ± standard error of the mean of CD8+ PD-1+ from 69 and 60 images for LAT(+) and LAT(−)A viruses, respectively, while each point for CD8+ Tim-3+ is from 20 and 34 images for LAT(+) and LAT(−)A viruses, respectively.
Fig. 4.
Fig. 4.
Detection of CD8+ gB+ cells in TG of latently infected mice. TG from five mice latently infected with LAT(+) or LAT(−)A virus were combined, and total T cells were isolated as described in Materials and Methods. Total T cells were stained with Pacific Blue-anti-CD8 and PE-gB498–505 pentamer and analyzed by FACS. (A) Representative histograms of CD3+ CD8+ T cells that are gB+ or gB and infected with LAT(+) virus from five pooled TG. (B) Representative histograms of CD3+ CD8+ T cells that are gB+ or gB and infected with LAT(−)A virus from five pooled TG. (C) Quantification of the mean number of CD8+ gB+ (left) and CD8+ gB (right) T cells per TG of LAT(+) and LAT(−)A virus-infected mice from four separate experiments. Experiment was repeated four times for a total of 40 TG (20 mice/group); values are means ± standard error of the means.
Fig. 5.
Fig. 5.
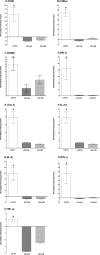
Effect of LAT on various transcripts in TG of latently infected mice. TG from latently infected mice, infected as described in the legend of Fig. 1, were individually isolated on day 30 p.i., and quantitative RT-PCR was performed using total RNA as described in Materials and Methods. CD4, CD8-α, CD8-β, PD-1, Tim-3, IL-21, IL-2, IFN-γ, and TNF-α expression in naive mice was used as a baseline control to estimate the relative expression of each transcript in TG of latently infected mice. GAPDH expression was used to normalize the relative expression of each transcript. Each point represents the mean ± standard error of the mean from 20 TG. Transcripts are as indicated above each graph.
Fig. 6.
Fig. 6.
Effect of PD-1, PD-L1, and PD-L2 deficiency on HSV-1 latency in TG of latently infected mice. C57BL/6 PD-1−/−, C57BL/6 PD-L1−/−, wt C57BL/6, BALB/c PD-L1−/−, BALB/c PD-L2−/−, and wt BALB/c mice were ocularly infected with HSV-1 strain McKrae [LAT(+)] as described in Materials and Methods. TG were harvested during latency on day 30 p.i., and quantitative RT-PCR was performed on individual TG for LAT expression. The estimated relative copy number of LAT was calculated using standard curves generated from pGem-5317, a LAT-containing plasmid. Briefly, DNA template was serially diluted 10-fold such that 5 μl contained from 103 to 1011 copies of LAT, and then samples were subjected to TaqMan PCR with the same set of primers. By comparing the normalized threshold cycle of each sample to the threshold cycle of the standard, the copy number for each reaction was determined. GAPDH expression was used to normalize the relative expression in the TG. Each point represents the mean ± standard error of the mean from 28, 20, 11, 9, and 11 TG in wt C57BL/6, C57BL/6 PD-1−/−, C57BL/6 PD-L1−/−, BALB/c PD-L1−/−, BALB/c PD-L2−/−, and wt BALB/c mice, respectively.
Fig. 7.
Fig. 7.
Detection of HSV-1 antigen in neurons of latently infected mice. C57BL/6 mice were ocularly infected with LAT(+) and LAT(−)A viruses as described in the legend of Fig. 1. TG from infected mice on day 30 p.i. were stained with MAP-2 and HSV FITC-conjugated antibodies, and presence of viral antigen was monitored by confocal microscopy as described in Materials and Methods. (A) Staining of LAT(+) and LAT(−)A TG, as indicated. Columns in respective order show DAPI nuclear staining (blue), HSV-gC expression in the TG (green), MAP-2 neuronal marker (red), and merged images of DAPI, FITC, and Alexa Fluor-647 images. Arrows indicate HSV-1-positive neurons, and arrowheads indicate HSV-1 viral antigen on the cell surface. (B) Quantification of photomicrographs. Sections from the entire TG were imaged, and the numbers of HSV-positive neurons were counted. Each point represents the mean ± standard error of the mean using multiple sections from 23 and 21 LAT(+) and LAT(−)A TG, respectively.

References

    1. Agata Y., et al. 1996. Expression of the PD-1 antigen on the surface of stimulated mouse T and B lymphocytes. Int. Immunol. 8:765–772 - PubMed
    1. Ahmed M., Fraser N. W. 2001. Herpes simplex virus type 1 2-kilobase latency-associated transcript intron associates with ribosomal proteins and splicing factors. J. Virol. 75:12070–12080 - PMC - PubMed
    1. Albareda M. C., et al. 2009. Chronic human infection with Trypanosoma cruzi drives CD4+ T cells to immune senescence. J. Immunol. 183:4103–4108 - PMC - PubMed
    1. Allen S. J., Mott K. R., Zandian M., Ghiasi H. 2010. Immunization with different viral antigens alters the pattern of T cell exhaustion and latency in HSV-1 infected mice. J. Virol. 84:12315–12324 - PMC - PubMed
    1. Barber D. L., et al. 2006. Restoring function in exhausted CD8 T cells during chronic viral infection. Nature 439:682–687 - PubMed

Publication types