. 2011 Feb 9;31(6):2064-78.
doi: 10.1523/JNEUROSCI.3334-10.2011.

Visuotopic organization of macaque posterior parietal cortex: a functional magnetic resonance imaging study

Affiliations

Visuotopic organization of macaque posterior parietal cortex: a functional magnetic resonance imaging study

Michael J Arcaro et al. J Neurosci. .

Abstract

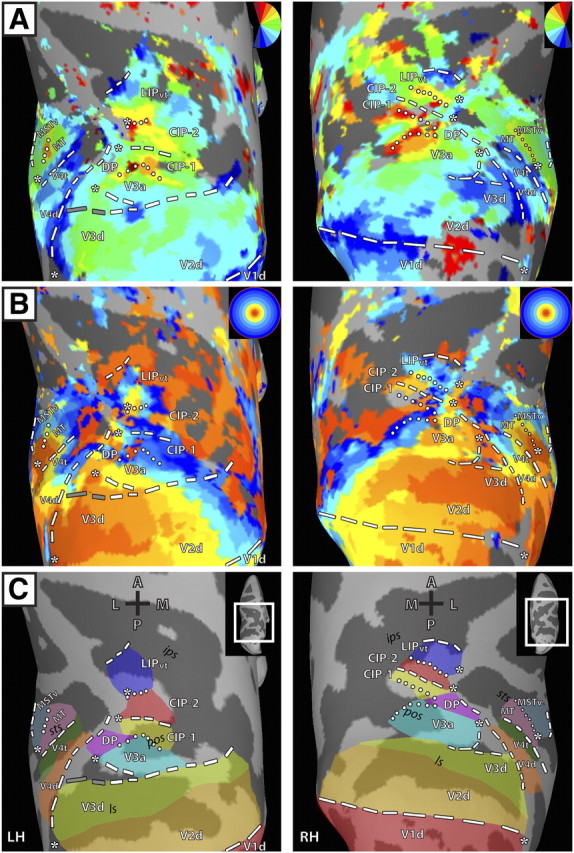
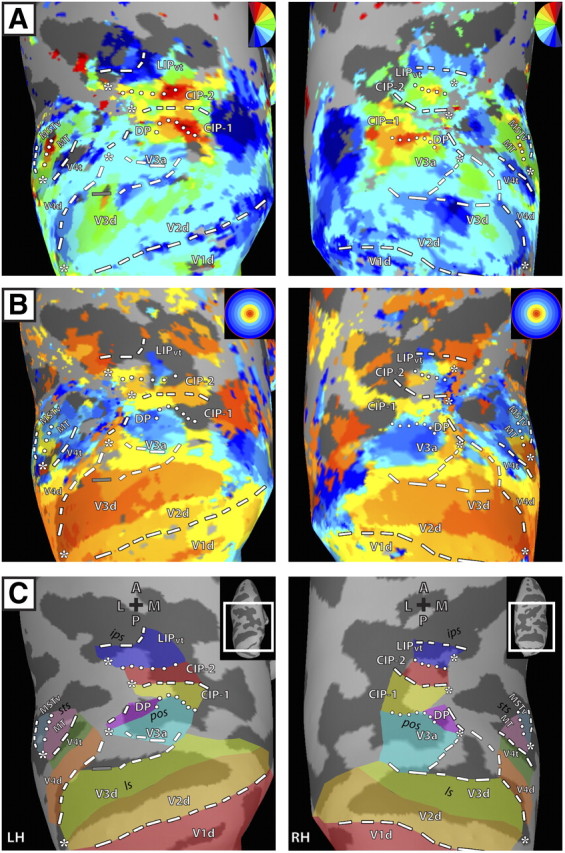
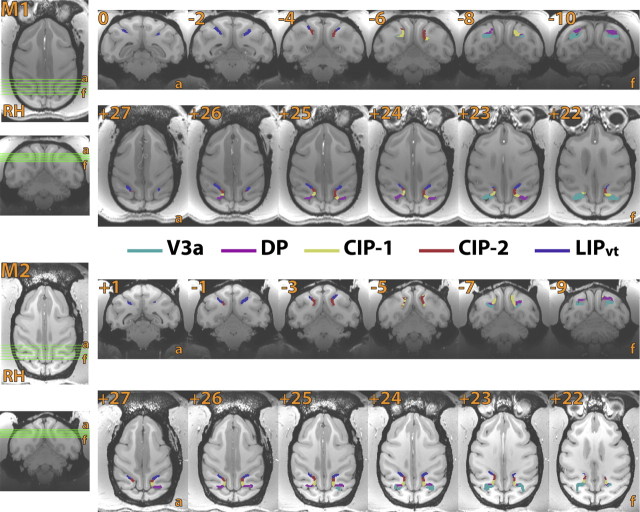
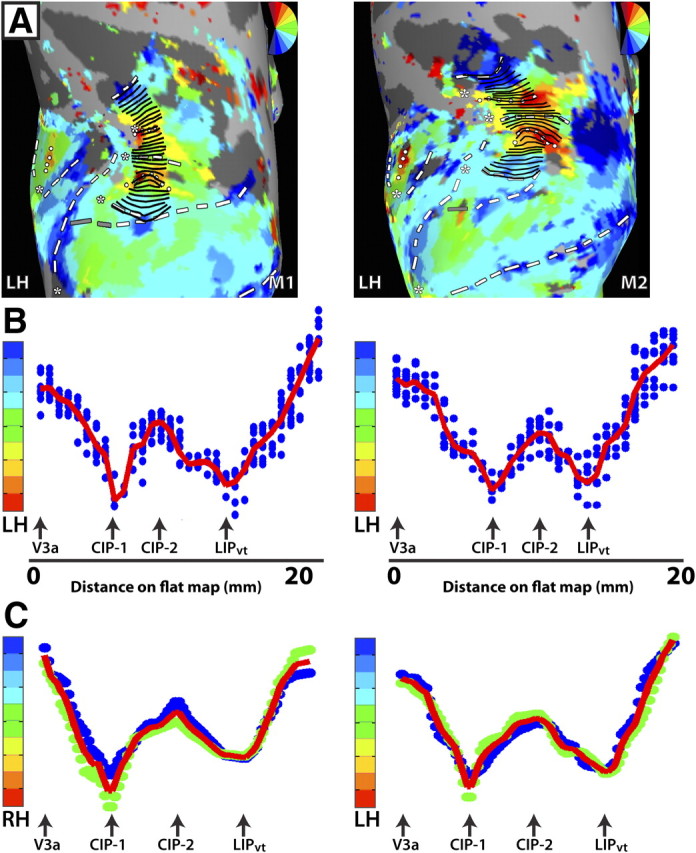
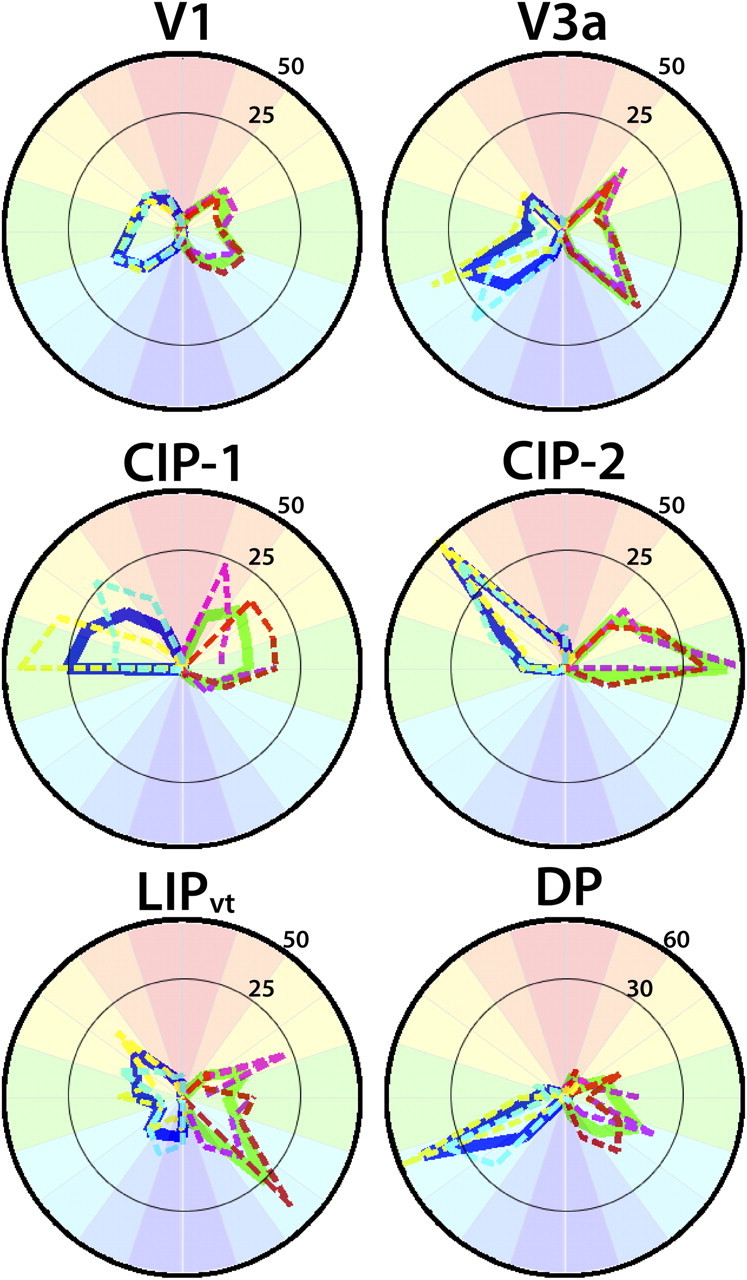
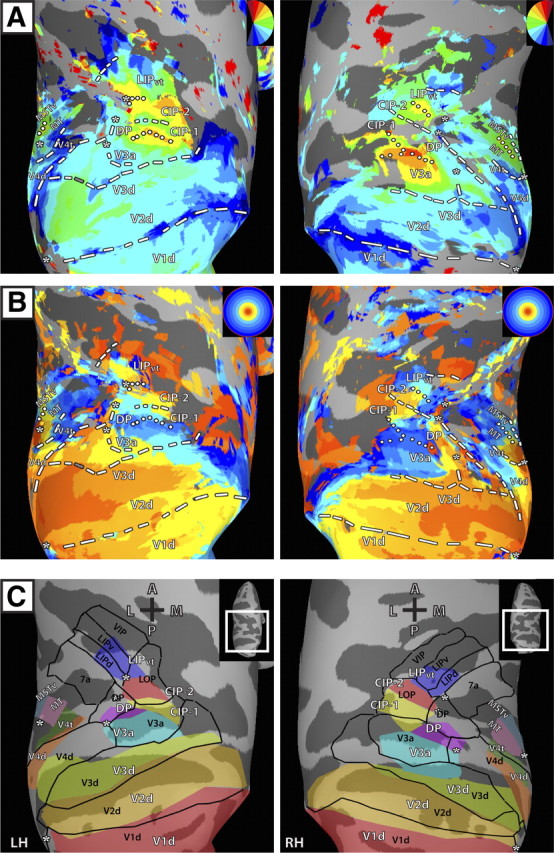
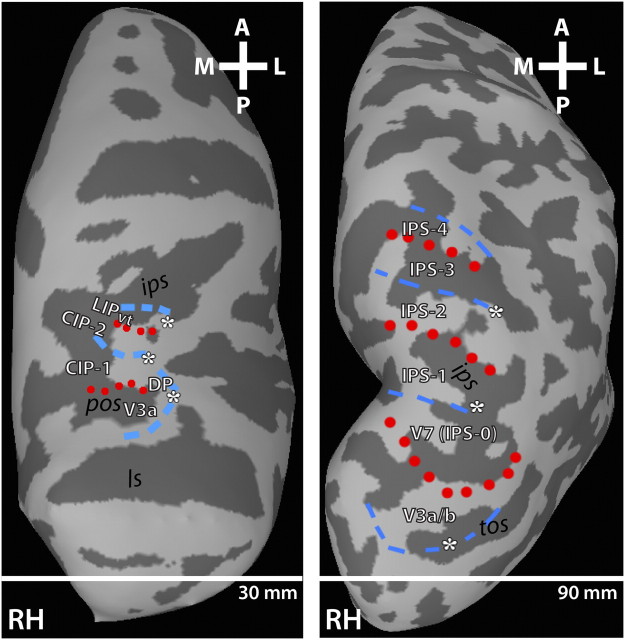
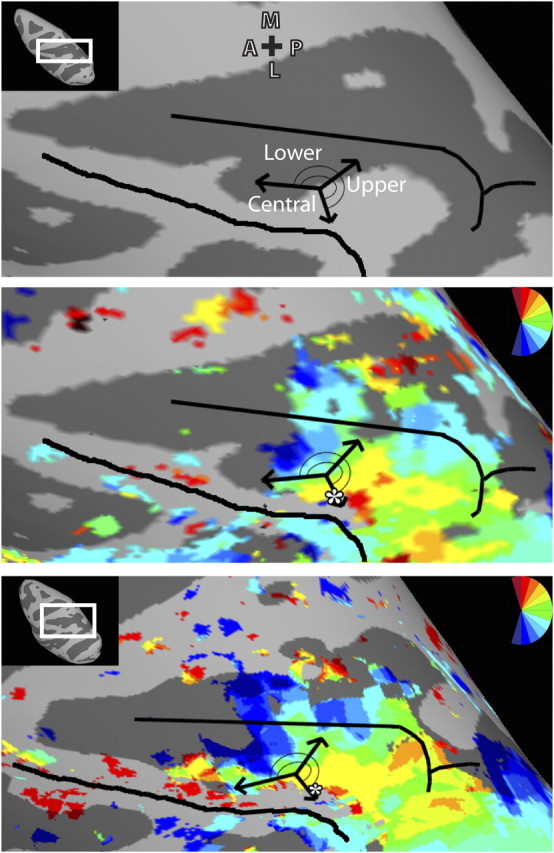
Macaque anatomy and physiology studies have revealed multiple visual areas in posterior parietal cortex (PPC). While many response properties of PPC neurons have been probed, little is known about PPC's large-scale functional topography-specifically related to visuotopic organization. Using high-resolution functional magnetic resonance imaging at 3 T with a phase-encoded retinotopic mapping paradigm in the awake macaque, a large-scale visuotopic organization along lateral portions of PPC anterior to area V3a and extending into the lateral intraparietal sulcus (LIP) was found. We identify two new visual field maps anterior to V3a within caudal PPC, referred to as caudal intraparietal-1 (CIP-1) and CIP-2. The polar angle representation in CIP-1 extends from regions near the upper vertical meridian (that is the shared border with V3a and dorsal prelunate) to those within the lower visual field (that is the shared border with CIP-2). The polar angle representation in CIP-2 is a mirror reversal of the CIP-1 representation. CIP-1 and CIP-2 share a representation of central space on the lateral border. Anterior to CIP-2, a third polar angle representation was found within LIP, referred to as visuotopic LIP. The polar angle representation in LIP extends from regions near the upper vertical meridian (that is the shared border with CIP-2) to those near the lower vertical meridian. Representations of central visual space were identified within dorsal portions of LIP with peripheral representations in ventral portions. We also consider the topographic large-scale organization found within macaque PPC relative to that observed in human PPC.


Figures

Figure 1.
Figure 1.
Polar angle and eccentricity maps in dorsal visual cortex for left and right hemispheres of M1. Inflated surface reconstructions of dorsal occipital and parietal cortex for M1. The left panel shows the topography for the LH and the right panel shows the topography for the RH. A, Polar angle maps for M1. The color code depicts the phase of the fMRI response and indicates the region of the visual field to which the surface node responds best. White lines denote area boundaries formed by phase angles at or close to the upper (dotted) or lower (dashed) vertical meridian. The gray dashed lines denote the discontinuity in the anterior border of area V3d. The surfaces are color coded such that the boundary between the dark gray and light gray represents the points of lowest curvature on the cortex with the midpoint across the dark gray region representing the fundus of the sulcal convexity and the midpoint across the light gray region representing the crown of the gyral convexity. Asterisks indicate representations of central space. Maps were thresholded at ±2 s per cycle SEM variance (see Materials and Methods). B, Eccentricity maps for M1. The color code indicates phase of the fMRI response and the region of the visual field to which the surface node responds best. C, Schematic borders of defined topographic regions overlaid on inflated surfaces to relate the functionally defined areas and the underlying anatomy. A, Anterior; P, posterior; M, medial; L, lateral; ls, lunate sulcus; pos, parieto-occipital sulcus; sts, superior temporal sulcus; ips, intraparietal sulcus.
Figure 2.
Figure 2.
Polar angle and eccentricity maps in dorsal visual cortex for left and right hemispheres of M2. Inflated surface reconstructions of dorsal occipital and parietal cortex of M2. All conventions and abbreviations are as in Figure 1.
Figure 3.
Figure 3.
Area boundaries of V3a, DP, CIP-1, CIP-2, and LIPvt of M1 and M2 in coronal and axial sections. Coronal (top) and axial (bottom) sections for monkey M1 (top) and M2 (bottom) slice segments are shown. Reference images are displayed on the left side, illustrating the coverage of each coronal and axial slice. Borders were defined on the surface, projected into the volume, and color coded by area.
Figure 4.
Figure 4.
Analysis of topographic organization within V3a, CIP-1, CIP-2, and LIPvt. A, Polar angle maps of dorsal occipital and parietal cortex for the LH of M1 (left column) and M2 (right column). Response phase was analyzed as a function of distance on the surface by drawing small line segments that run parallel to the polar angle progression and perpendicular to the eccentricity progression. The line segments were successively drawn from the lateral, posterior border of V3a to the anterior border of LIPvt. B, Polar angle phase plot for LH of M1 (left column) and M2 (right column) as a function of distance from the lateral, posterior border of V3a (in mm). The blue dots indicate the phase values for individual nodes located along the line segments. The red line indicates the average phase values as a function of distance on the surface. Note the smooth progression of phase values as a function of distance on the map. Importantly, the response phase reverses at the shared boundaries between adjacent areas (black arrows). C, Group polar angle phase plots are shown for both RH and LH (N = 2). Phase values within a given area were interpolated into a common space, which allowed for intersubject averaging. The blue and green dots indicate phase values for individual subjects after interpolation. The red line indicates the group average. The smooth progression of phase values within a given area and the phase reversals at area boundaries are apparent in the group averages as well as in the individual subjects.
Figure 5.
Figure 5.
Visual field representations in areas V1, V3a, DP, CIP-1, CIP-2, and LIPvt. Polar angle plots based on polar angle maps thresholded at 2 s of the cycle SEM variance (see Materials and Methods). The percentage of visual field coverage within each area was calculated for both monkeys individually and then averaged. Dashed lines correspond to visual field coverage for individual monkeys (M1: yellow RH, purple LH; M2: light blue RH, red LH). The solid lines correspond to the average visual field coverage (RH: blue; LH: green). All areas almost exclusively represented contralateral visual space with little variance in visual field representation between the two monkeys.
Figure 6.
Figure 6.
Average polar angle and eccentricity maps in dorsal occipital and parietal cortex on standard-mesh surfaces in comparison to the Lewis/Van Essen parcellation. Standard-mesh surfaces were created from the individual cortical surface reconstructions of each monkey (see Materials and Methods). The use of standard-mesh surfaces allowed for node-to-node correspondence across surfaces of both monkeys. A, B, All conventions and abbreviations as in Figure 1. C, Schematic borders of topographically defined areas (see Figs. 1C, 2C) in conjunction with borders of visual areas from the Lewis and Van Essen parcellation (2000a,b) in the F99 macaque atlas (Van Essen, 2002) (black lines and labels).
Figure 7.
Figure 7.
Comparison of dorsal visual cortex topography between monkey and human. Comparison of the fMRI-defined retinotopic organization of dorsal occipital and parietal cortex in both monkeys (left column) and humans (right column). Lines denote areal boundaries formed by phase angles at or close to the upper (red, dotted) or lower (blue, dashed) vertical meridian. ls, Lunate sulcus; pos, parieto-occipital sulcus; ips, intraparietal sulcus; tos, transverse occipital sulcus.
Figure 8.
Figure 8.
Comparison of LIP topography based on physiology and fMRI data. Top, Schema of LIP topography adapted with permission from Ben Hamed et al. (2001) (their Fig. 8C). The fundus of the IPS and crown of the inferior parietal lobule are denoted by black lines. A representation of the upper visual field was found in posterior LIP, and the lower visual field representation was found anterior. A representation of central space was identified on the lateral border of LIP. Middle and bottom, The schema of LIP topography defined by physiology data overlaid upon the topography of LIPvt from the LH of monkey M1 (middle) and the group map (bottom) revealed by fMRI. There is strong correspondence of LIP topography between the physiology and fMRI data with the upper visual field progressing anterior and medial to a lower visual field representation, and a representation of central space on the lateral border (white asterisk).

References

    1. Andersen RA, Asanuma C, Essick G, Siegel RM. Corticocortical connections of anatomically and physiologically defined subdivisions within the inferior parietal lobule. J Comp Neurol. 1990;296:65–113. - PubMed
    1. Arcaro MJ, McMains SA, Singer BD, Kastner S. Retinotopic organization of human ventral visual cortex. J Neurosci. 2009;29:10638–10652. - PMC - PubMed
    1. Argall BD, Saad ZS, Beauchamp MS. Simplified intersubject averaging on the cortical surface using SUMA. Hum Brain Mapp. 2006;27:14–27. - PMC - PubMed
    1. Bandettini PA, Jesmanowicz A, Wong EC, Hyde JS. Processing strategies for time-course data sets in functional MRI of the human brain. Magn Reson Med. 1993;30:161–173. - PubMed
    1. Ben Hamed S, Duhamel JR, Bremmer F, Graf W. Representation of the visual field in the lateral intraparietal area of macaque monkeys: a quantitative receptive field analysis. Exp Brain Res. 2001;140:127–144. - PubMed

Publication types