

Nonuniform high-gamma (60-500 Hz) power changes dissociate cognitive task and anatomy in human cortex
- PMID: 21307246
- PMCID: PMC3737077
- DOI: 10.1523/JNEUROSCI.4722-10.2011
Nonuniform high-gamma (60-500 Hz) power changes dissociate cognitive task and anatomy in human cortex
Abstract
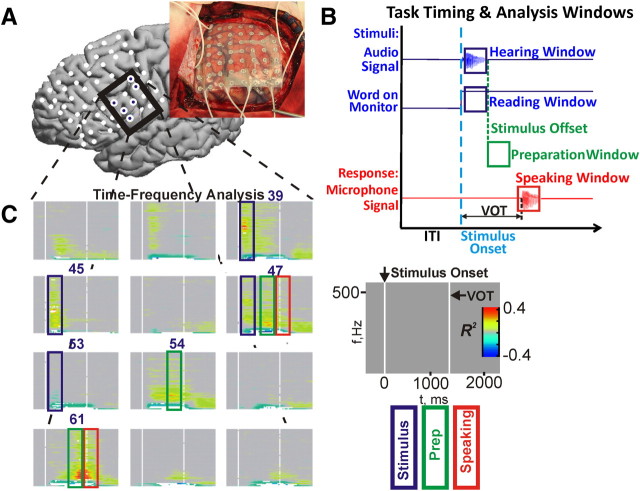
High-gamma-band (>60 Hz) power changes in cortical electrophysiology are a reliable indicator of focal, event-related cortical activity. Despite discoveries of oscillatory subthreshold and synchronous suprathreshold activity at the cellular level, there is an increasingly popular view that high-gamma-band amplitude changes recorded from cellular ensembles are the result of asynchronous firing activity that yields wideband and uniform power increases. Others have demonstrated independence of power changes in the low- and high-gamma bands, but to date, no studies have shown evidence of any such independence above 60 Hz. Based on nonuniformities in time-frequency analyses of electrocorticographic (ECoG) signals, we hypothesized that induced high-gamma-band (60-500 Hz) power changes are more heterogeneous than currently understood. Using single-word repetition tasks in six human subjects, we showed that functional responsiveness of different ECoG high-gamma sub-bands can discriminate cognitive task (e.g., hearing, reading, speaking) and cortical locations. Power changes in these sub-bands of the high-gamma range are consistently present within single trials and have statistically different time courses within the trial structure. Moreover, when consolidated across all subjects within three task-relevant anatomic regions (sensorimotor, Broca's area, and superior temporal gyrus), these behavior- and location-dependent power changes evidenced nonuniform trends across the population. Together, the independence and nonuniformity of power changes across a broad range of frequencies suggest that a new approach to evaluating high-gamma-band cortical activity is necessary. These findings show that in addition to time and location, frequency is another fundamental dimension of high-gamma dynamics.
Figures


Similar articles
-
Functional mapping of human sensorimotor cortex with electrocorticographic spectral analysis. II. Event-related synchronization in the gamma band.Brain. 1998 Dec;121 ( Pt 12):2301-15. doi: 10.1093/brain/121.12.2301. Brain. 1998. PMID: 9874481
-
Electrocorticographic frequency alteration mapping for extraoperative localization of speech cortex.Neurosurgery. 2010 Feb;66(2):E407-9. doi: 10.1227/01.NEU.0000345352.13696.6F. Neurosurgery. 2010. PMID: 20087111
-
Electrocorticographic gamma activity during word production in spoken and sign language.Neurology. 2001 Dec 11;57(11):2045-53. doi: 10.1212/wnl.57.11.2045. Neurology. 2001. PMID: 11739824
-
Biomarkers in Alzheimer's disease with a special emphasis on event-related oscillatory responses.Suppl Clin Neurophysiol. 2013;62:237-73. doi: 10.1016/b978-0-7020-5307-8.00020-x. Suppl Clin Neurophysiol. 2013. PMID: 24053044 Review.
-
Cortical γ responses: searching high and low.Int J Psychophysiol. 2011 Jan;79(1):9-15. doi: 10.1016/j.ijpsycho.2010.10.013. Epub 2010 Nov 23. Int J Psychophysiol. 2011. PMID: 21081143 Free PMC article. Review.
Cited by
-
Modulation of Spectral Representation and Connectivity Patterns in Response to Visual Narrative in the Human Brain.Front Hum Neurosci. 2022 Oct 6;16:886938. doi: 10.3389/fnhum.2022.886938. eCollection 2022. Front Hum Neurosci. 2022. PMID: 36277048 Free PMC article.
-
Optimal referencing for stereo-electroencephalographic (SEEG) recordings.Neuroimage. 2018 Dec;183:327-335. doi: 10.1016/j.neuroimage.2018.08.020. Epub 2018 Aug 17. Neuroimage. 2018. PMID: 30121338 Free PMC article.
-
Characterization of the effects of the human dura on macro- and micro-electrocorticographic recordings.J Neural Eng. 2014 Feb;11(1):016006. doi: 10.1088/1741-2560/11/1/016006. J Neural Eng. 2014. PMID: 24654268 Free PMC article.
-
Cortical high-gamma responses in auditory processing.Am J Audiol. 2011 Dec;20(2):171-80. doi: 10.1044/1059-0889(2011/10-0036). Am J Audiol. 2011. PMID: 22158634 Free PMC article. Review.
-
Influence of White and Gray Matter Connections on Endogenous Human Cortical Oscillations.Front Hum Neurosci. 2016 Jun 28;10:330. doi: 10.3389/fnhum.2016.00330. eCollection 2016. Front Hum Neurosci. 2016. PMID: 27445767 Free PMC article.
References
-
- Ad-Tech Medical Instrument Corporation. Racine, WI: Ad-Tech Medical Instrument Corporation; 2008. 2008 Product catalog—epilepsy and neurosurgery product guide.
-
- Benjamini Y, Hochberg Y. Controlling the false discovery rate: a practical and powerful approach to multiple testing. J R Stat Soc Series B Stat Methodol. 1995;57:289–300.
-
- Bragin A, Wilson CL, Staba RJ, Reddick M, Fried I, Engel J., Jr Interictal high-frequency oscillations (80–500 Hz) in the human epileptic brain: entorhinal cortex. Ann Neurol. 2002;52:407–415. - PubMed
Publication types
MeSH terms
Grants and funding
LinkOut - more resources
Full Text Sources
Other Literature Sources