. 2011 Feb 9;31(6):2238-47.
doi: 10.1523/JNEUROSCI.3624-10.2011.

Polarization-sensitive descending neurons in the locust: connecting the brain to thoracic ganglia

Affiliations

Polarization-sensitive descending neurons in the locust: connecting the brain to thoracic ganglia

Ulrike Träger et al. J Neurosci. .

Abstract

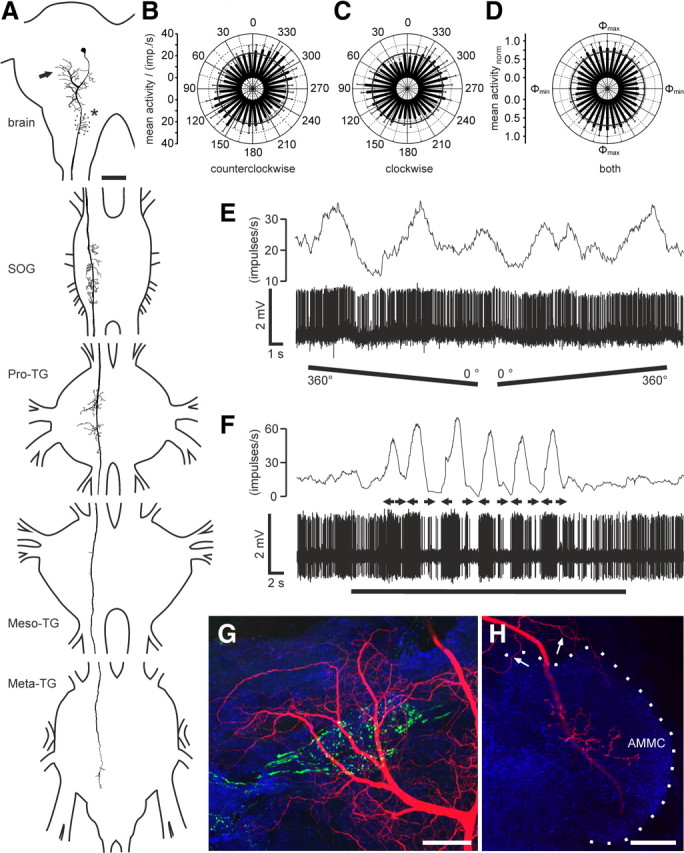
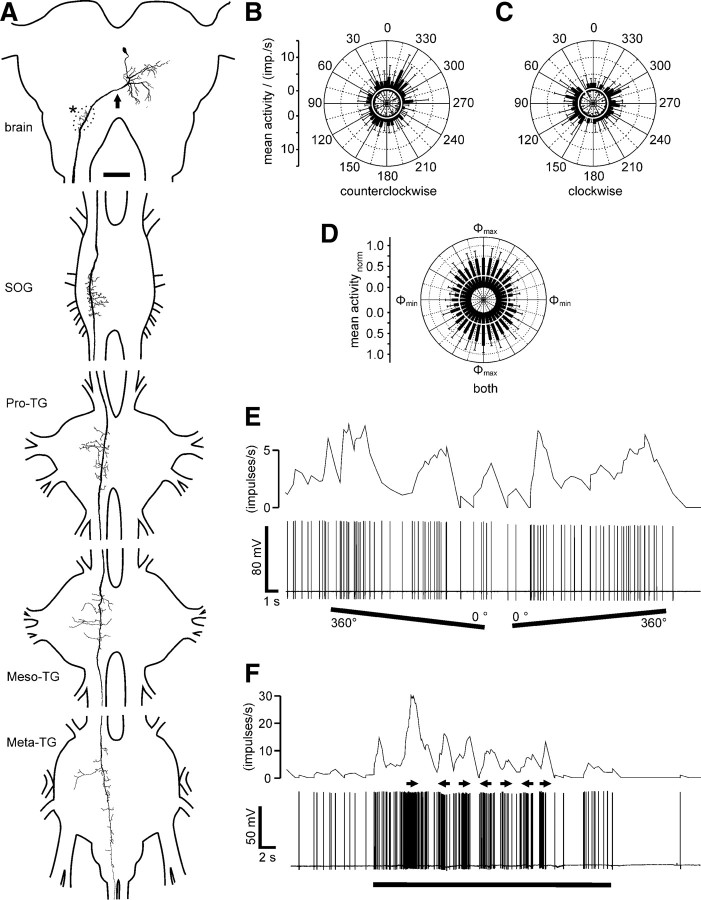
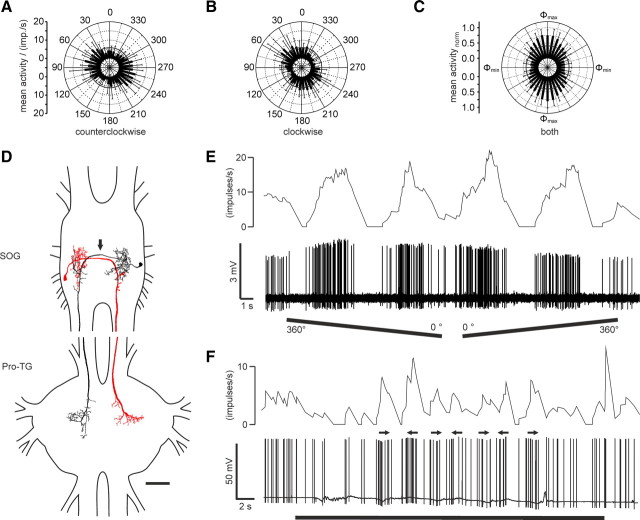
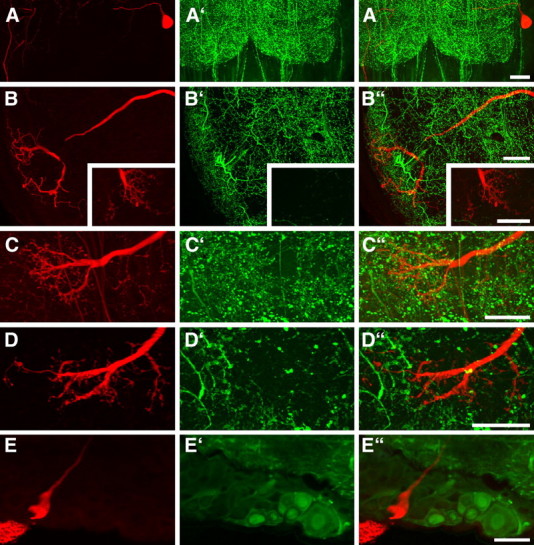
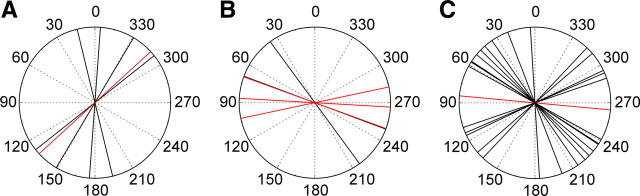
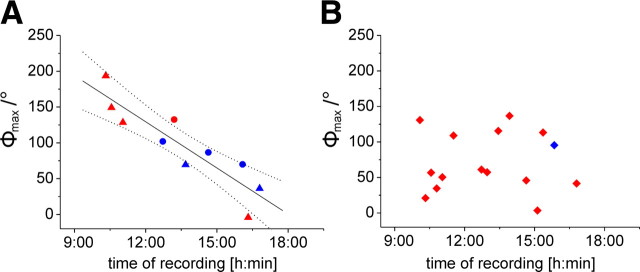
Many animal species, in particular insects, exploit the E-vector pattern of the blue sky for sun compass navigation. Like other insects, locusts detect dorsal polarized light via photoreceptors in a specialized dorsal rim area of the compound eye. Polarized light information is transmitted through several processing stages to the central complex, a brain area involved in the control of goal-directed orientation behavior. To investigate how polarized light information is transmitted to thoracic motor circuits, we studied the responses of locust descending neurons to polarized light. Three sets of polarization-sensitive descending neurons were characterized through intracellular recordings from axonal fibers in the neck connectives combined with single-cell dye injections. Two descending neurons from the brain, one with ipsilaterally and the second with contralaterally descending axon, are likely to bridge the gap between polarization-sensitive neurons in the brain and thoracic motor centers. In both neurons, E-vector tuning changed linearly with daytime, suggesting that they signal time-compensated spatial directions, an important prerequisite for navigation using celestial signals. The third type connects the suboesophageal ganglion with the prothoracic ganglion. It showed no evidence for time compensation in E-vector tuning and might play a role in flight stabilization and control of head movements.


Figures

Figure 1.
Figure 1.
Morphology and response characteristics of ipsilaterally descending brain neurons. A, Reconstruction of arborizations in the brain (posterior view), SOG, and the three thoracic ganglia (dorsal view). Arborizations in all ganglia are confined to the ipsilateral hemispheres. Dendritic ramifications are in the posterior protocerebrum at the level of the posterior optic tubercle (arrow; POTu, gray shaded; see also G). The antennal mechanosensory and motor center (dotted line, asterisk; see also H) is invaded by beaded arborizations. An axonal fiber descends through the SOG with ramifications extending laterally and medially around the axon. In the Pro-TG, two characteristic areas of ramification extend laterally. The axon passes through the mesothoracic (Meso-TG) and metathoracic (Meta-TG) ganglion, with only sparse side branches, and could not be traced beyond the fused first abdominal ganglion. B, C, Circular diagrams of mean frequencies of action potentials plotted against E-vector orientation during dorsal stimulation with a rotating polarizer. Background activity is indicated by a black circle within each plot. B, During counterclockwise rotations of the polarizer, E-vector tuning (Φmax) was at 142° (n = 7; error bars indicate SD; bin size, 10°; p = 1.9 × 10⁻¹²). C, The preferred E-vector orientation during clockwise rotations (n = 7; error bars indicate SD; bin size, 10°; p = 2.2 × 10⁻⁸) had a Φmax of 111° and differed significantly from Φmax during counterclockwise rotations (n = 7; p = 0.009, Student's t test for paired probes). D, Circular diagram showing normalized mean activities from all recordings (n = 6) to dorsal stimulation through a rotating polarizer with Φmax set to 0°. Background activity is indicated by a black circle. E, Spike train (bottom trace) and mean spiking frequency (top trace; gliding average with bin size of 1 s) from the same neuron as in B and C during a counterclockwise (360–0°) and a clockwise (0–360°) rotation of the polarizer. F, Responses to a moving black and white grating presented in front of the animal. A small cardboard with black and white stripes was moved by hand from left to right and vice versa under unpolarized light condition (black bar). Black arrows indicate movement direction of the pattern as seen by the locust. The neuron with the soma in the left brain hemisphere was excited by movement from right to left and shows inhibition to moving bars from left to right. G, H, Morphological details in the brain. Maximum intensity views of optical sections (frontal plane; thickness, 2 μm) from confocal image stacks showing anti-synapsin staining (blue), anti-PDH immunostaining (green), and ramifications of the Neurobiotin-stained neuron (red). G, Maximum intensity projection of 78 optical sections showing ramifications around the posterior optic tubercle (POTu), which is marked with the anti-PDH antiserum. H, Maximum intensity projection of two combined stacks (76 optical sections), showing varicose arborizations in the antennal mechanosensory and motor center (AMMC). Some dendritic arborizations are visible dorsally from the antennal mechanosensory and motor center. Scale bars: A, 200 μm; G, H, 40 μm.
Figure 2.
Figure 2.
Morphology and response characteristics of a contralaterally descending brain neuron (A–C, E, F) and normalized average response of all recordings (D). A, Reconstruction of arborizations in the brain (posterior view), SOG, and the three thoracic ganglia (dorsal view). The neuron has its soma and presumably dendritic arborizations in the ipsilateral posterior median protocerebrum. The axon crosses the midline of the brain (arrow) and descends through the contralateral connective. Presumably presynaptic endings with beaded terminals are in the antennal mechanosensory and motor center (asterisk). The neuron descends through the SOG and thoracic ganglia and sends a fiber, which could not be traced further, into the connective toward the free unfused abdominal ganglia. All ramifications in the ventral nerve cord are confined to the contralateral hemisphere and have beaded, presumably presynaptic, terminals in dorsal aspects of the ganglia. Meso-TG, Mesothoracic ganglion; Meta-TG, metathoracic ganglion B, C, Circular diagrams of mean frequencies of action potentials of the neuron against E-vector orientation during dorsal stimulation with a rotating polarizer. Each rotation direction is shown separately. Background activity is indicated by a white circle within each plot. B, During counterclockwise rotations of the polarizer, the neuron had a preferred E-vector orientation (Φmax) of 157° (n = 5; error bars indicate SD; bin size, 10°; p = 7.38 × 10⁻⁴). C, The preferred E-vector orientation during clockwise rotations (n = 5; error bars indicate SD; bin size, 10°; p = 5.74 × 10⁻⁴) had a Φmax of 103° and differed significantly from Φmax during counterclockwise rotations (n = 5; p = 0.002, Student's t test for paired probes). D, Circular diagram showing normalized mean activities from all recordings (n = 4) to dorsal stimulation through a rotating polarizer with Φmax set to 0°. Background activity is indicated by a white circle. E, Spike train (bottom trace) and mean spiking frequency (top trace; gliding average with bin size of 1 s) of the neuron during a counterclockwise (360–0°) and a clockwise (0–360°) rotation of the polarizer. F, Responses to a moving black and white grating presented in front of the animal. A small cardboard with black and white stripes was moved by hand from left to right and vice versa under unpolarized light condition (black bar). Black arrows indicate movement direction of the pattern as seen by the locust. The neuron was activated during movements in both directions. The response decreased with repetition of stimuli. Scale bar, 200 μm.
Figure 3.
Figure 3.
Response characteristics and morphology of descending neurons from the SOG. A, B, Circular diagrams of mean frequencies of action potentials of the neuron against E-vector orientation during dorsal stimulation with a rotating polarizer. Each rotation direction is shown separately. Background activity is indicated by a black circle within each plot. A, During counterclockwise rotations of the polarizer, the neuron had a preferred E-vector orientation (Φmax) of 70° (n = 11; error bars indicate SD; bin size, 10°; p < 10−12). B, The preferred E-vector orientation (Φmax) during clockwise rotations (n = 11; error bars indicate SD; bin size, 10°; p < 10−12) was at 27° and differed significantly from Φmax during counterclockwise rotations (n = 11; p < 0.001, Student's t test for paired probes). C, Circular diagram showing normalized mean activities from all recordings (n = 16) to dorsal stimulation through a rotating polarizer with Φmax set to 0°. Background activity is indicated by a black circle. D, Horizontal superimposed reconstructions (dorsal view). The red neuron is mirrored. Both neurons differ slightly in morphology. They have their somata and presumably dendritic arborizations in posterior parts in the ipsilateral hemisphere of the SOG. Axons cross the midline (arrow), give rise to presumably presynaptic endings with bleb-like structures that partly overlap with the input region of the contralateral homolog, and descend through the contralateral connective. The neurons have axonal beaded ramifications that differ slightly between the two cells in a narrow dorsal part of the Pro-TG. E, Spike train (bottom trace) and mean spiking frequency (top trace; gliding average with bin size of 1 s) of the same neuron as in A and B during a counterclockwise (360–0°) and a clockwise (0–360°) rotation of the polarizer. F, Responses to a moving black and white grating presented in front of the animal (red neuron in D). A small cardboard with black and white stripes was moved by hand from left to right and vice versa under unpolarized light condition (black bar). Black arrows indicate movement direction of the pattern as seen by the locust. The neuron showed weak activations to movements in both directions. Scale bar, 200 μm.
Figure 4.
Figure 4.
Polarized-light sensitivity and E-vector tuning of the descending SOG neurons when stimulated with polarized light from different elevations along the right–left meridian. A, Response amplitudes from individual recordings, distinguished by different colors, plotted against elevation of polarized-light stimulus. Elevation is plotted with respect to the location of the soma (0i–60i in the ipsilateral and 0c–60c in the contralateral hemisphere of the SOG) and was sampled along the right–left meridian with respect to the locust. Values were normalized to the largest R value of each neuron (i.e., the receptive field center). Data points are connected by lines for better visibility. Dotted line indicates background variability for the neuron type, which has been renormalized with respect to the mean receptive field center. B, Average receptive field for the examined SOG neurons. Dotted line, Background variability. Values are means ± SE. C, Deviations of Φmax values at different elevations from zenithal Φmax values. Differences in Φmax values are plotted against the elevation. A significant correlation was observed (Rcor = 0.53, p = 0.00453). Colors of data points correspond to the colors in A.
Figure 5.
Figure 5.
Confocal images of 130 μm sections showing parts of Neurobiotin-stained descending SOG neurons (red) combined with immunostaining using antisera against FMRFamide, serotonin, Lom-TK II, AST-A, or GABA (green). The Neurobiotin-stained somata and ramifications are shown in A–E, the immunostainings are shown in A′–E′, and the combined illustrations are shown in A‴–E‴. None of the tested neuroactive substance is localized in the stained neurons. A, Soma and part of the primary neurite in the SOG. FMRFamide immunostaining is not present in the soma or axon of the neuron. B, Dendritic ramifications in the SOG and presynaptic terminals from the Pro-TG (inset). The labeled neuron does not show serotonin immunostaining. C, D, In the Pro-TG, presynaptic terminals with bleb-like endings do not show immunostaining for Lom-TK II (C) or AST-A (D). E, The soma of the SOG neuron does not exhibit GABA immunostaining. Scale bars, 40 μm.
Figure 6.
Figure 6.
Distribution of Φmax values in the three types of descending neuron. A, Φmax values from brain POL-neurons with descending axons in the left connective. E-vector orientations (ipsilaterally descending, black; contralaterally descending, red) seem to be clustered around 154°, but the distribution is not significantly different from randomness (Rao's spacing test, p > 0.01). B, Φmax values from brain POL-neurons with descending axons in the right connective. Φmax values are clustered around 74°, but the distribution is not significantly different from randomness (Rao's spacing test, p > 0.1; same color code as in A). C, Φmax values of all SOG neurons (the red value is mirrored) descending through the left connective. Φmax values are clustered around 42° and 116°, but the distribution is not significantly different from randomness (Rao's spacing test, p > 0.1).
Figure 7.
Figure 7.
Daytime-dependent preferred E-vector orientations (Φmax) in descending POL-neurons. Φmax values of the three descending neuron types are plotted against standard time (Central European Time) of recording. A, A correlation was observed for the combined values from the two types of brain descending neuron (Rcor = −0.9, t test against the slope of 0, p = 0.00039; y = −515.91x + 387.37), indicated by the regression line with 95% confidence intervals. Data from ipsilaterally descending neurons (triangles) and contralaterally descending neurons (dots) are included. Neurons with axons in the left connective are shown in red and those with axons in the right connective in blue. B, No correlation was observed for the descending SOG neurons (Rcorr = 0.11, p = 0.97). Most SOG neurons were recorded from the left connective (red squares); only one recording was from the right connective (blue square).

Similar articles

Cited by

References

    1. Bacon JP, Thompson KS, Stern M. Identified octopamine neurons provide an arousal mechanism in the locust brain. J Neurophysiol. 1995;74:2739–2743. - PubMed
    1. Blair HT, Sharp PE. Anticipatory head direction signals in anterior thalamus: evidence for a thalamocortical circuit that integrates angular head motion to compute head direction. J Neurosci. 1995;15:6260–6270. - PMC - PubMed
    1. Brunner D, Labhart T. Behavioural evidence for polarization vision in crickets. Physiol Entomol. 1987;12:1–10.
    1. Dacke M, Nordström P, Scholtz CH. Twilight orientation to polarized light in the crepuscular dung beetle Scarabaeus zambesianus. J Exp Biol. 2003;206:1535–1543. - PubMed
    1. Dircksen H, Zahnow CA, Gaus G, Keller R, Rao KR, Riehm JP. The ultrastructure of nerve endings containing pigment-dispersing hormone (PDH) in crustacean sinus glands: identification by an antiserum against a synthetic PDH. Cell Tissue Res. 1987;250:377–387.

Publication types

MeSH terms

LinkOut - more resources