. 2011 Feb 9;31(6):2292-304.
doi: 10.1523/JNEUROSCI.2733-10.2011.

p75NTR regulates Abeta deposition by increasing Abeta production but inhibiting Abeta aggregation with its extracellular domain

Affiliations

p75NTR regulates Abeta deposition by increasing Abeta production but inhibiting Abeta aggregation with its extracellular domain

Yan-Jiang Wang et al. J Neurosci. .

Abstract

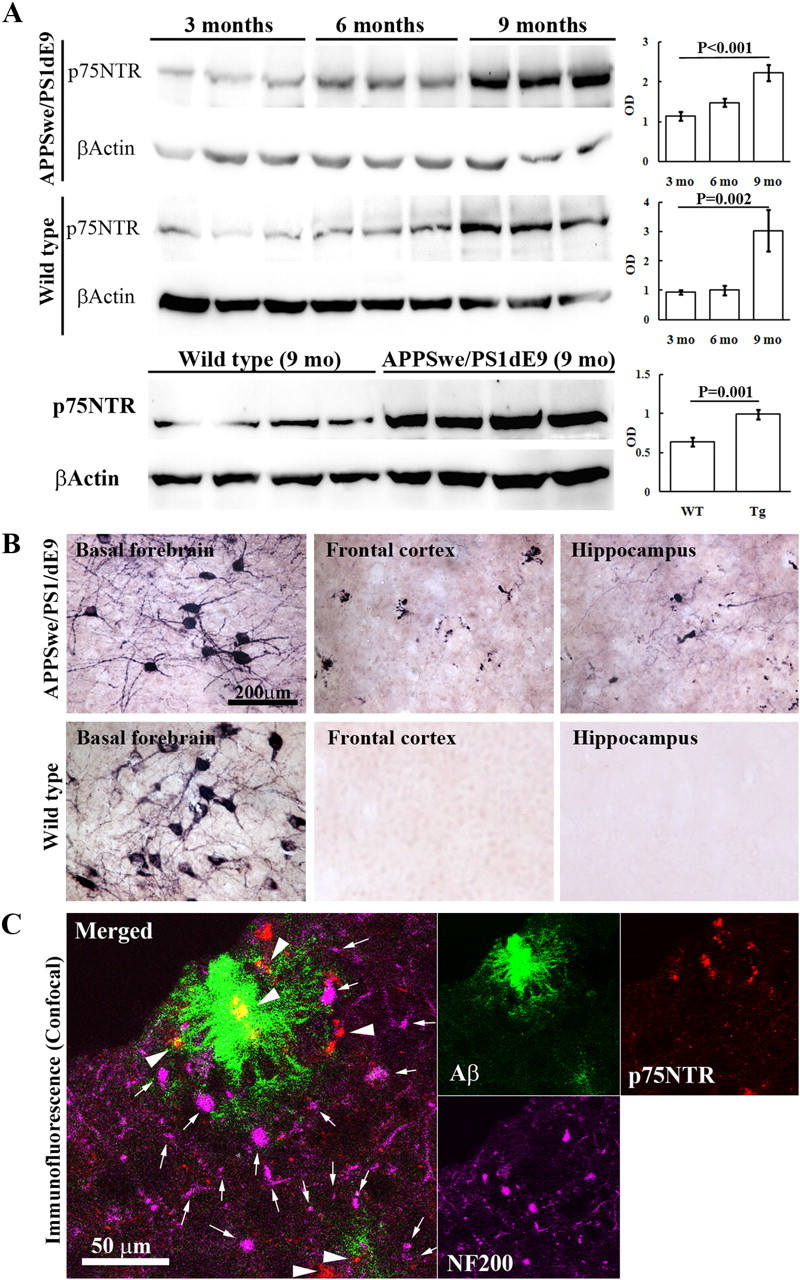
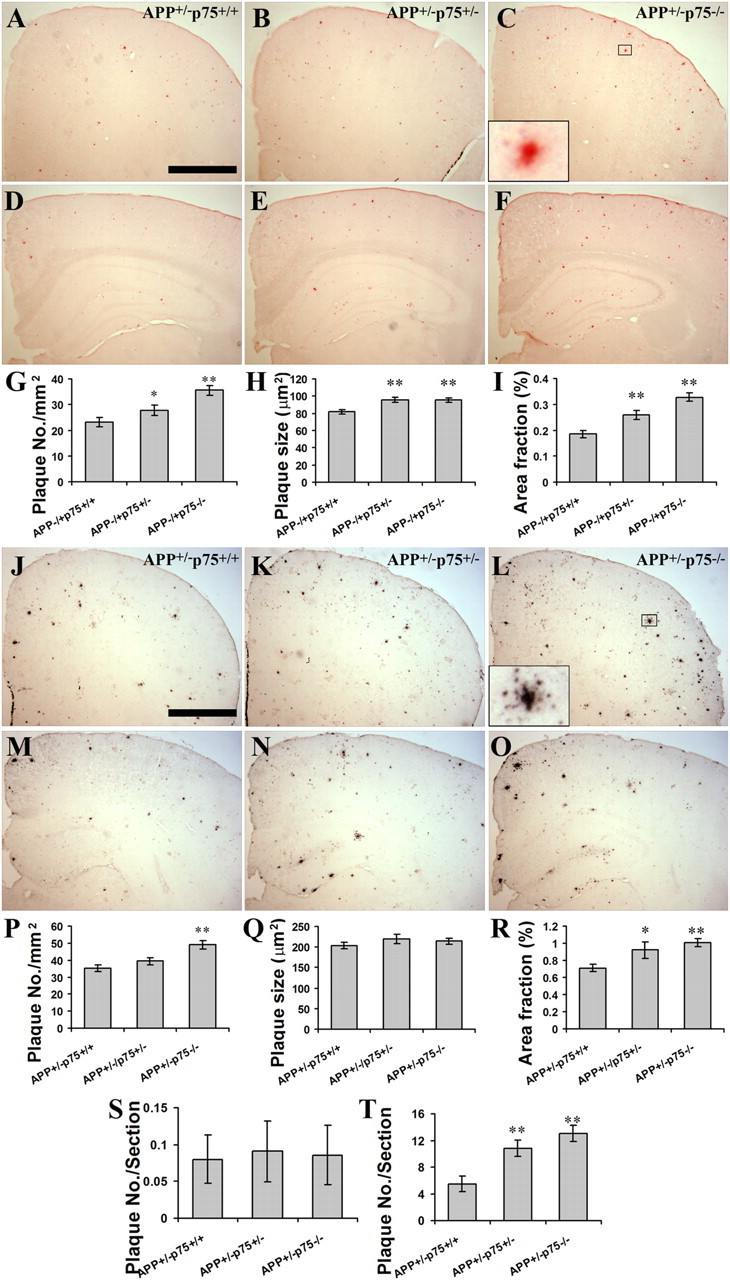
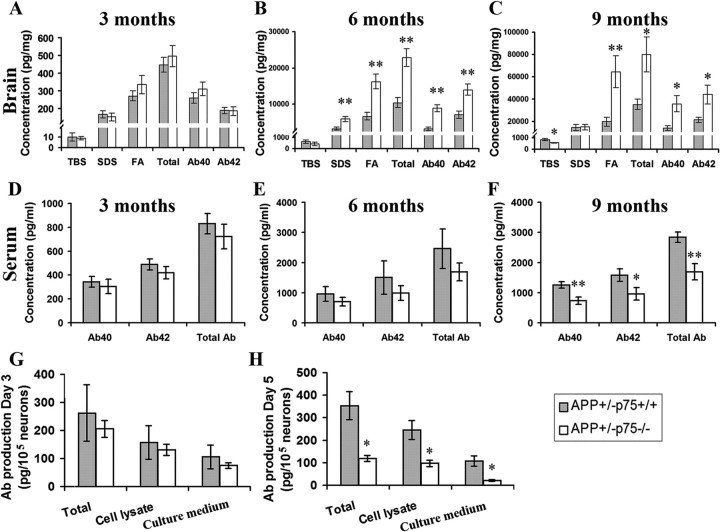
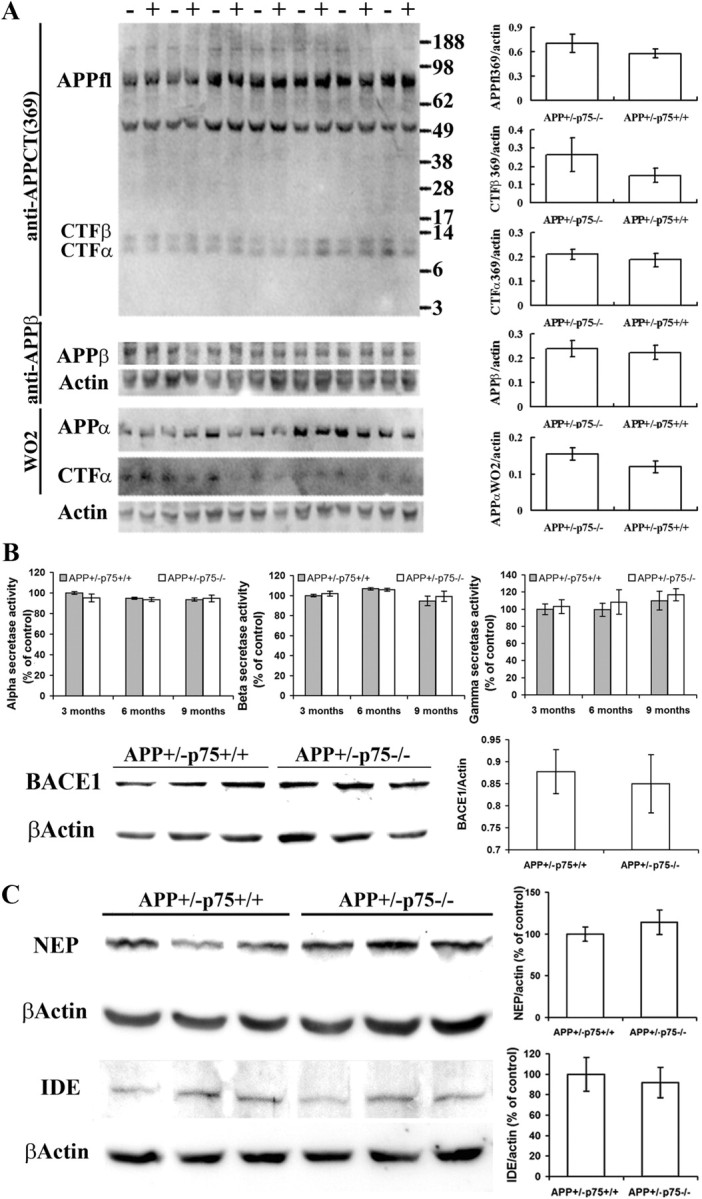
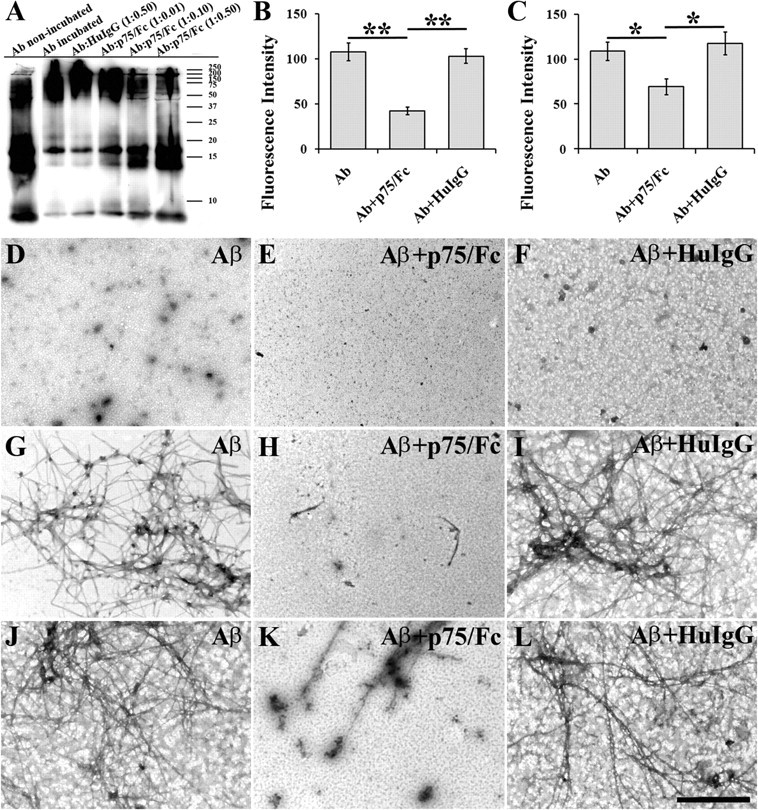
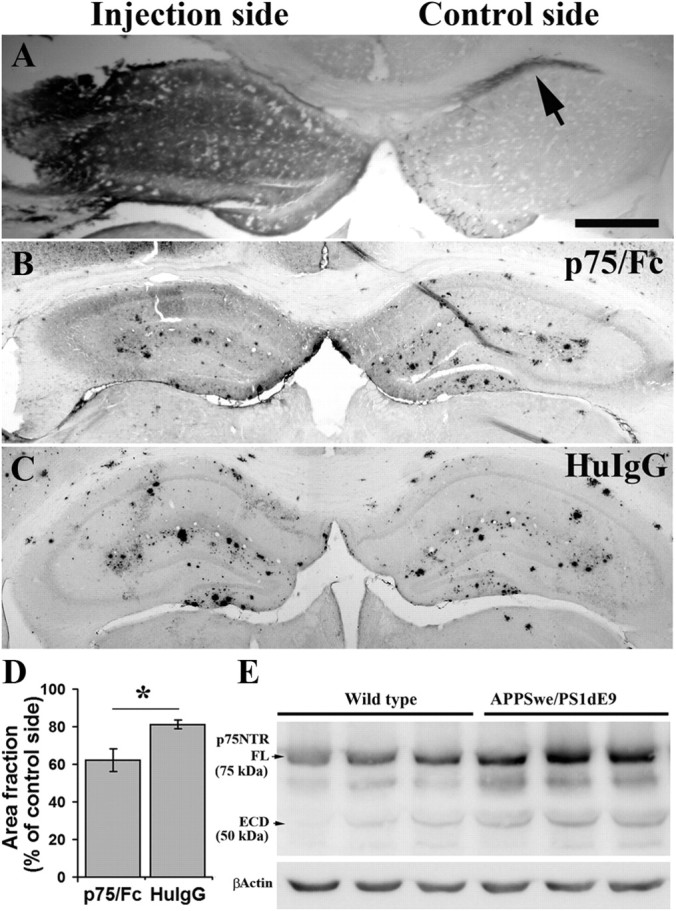
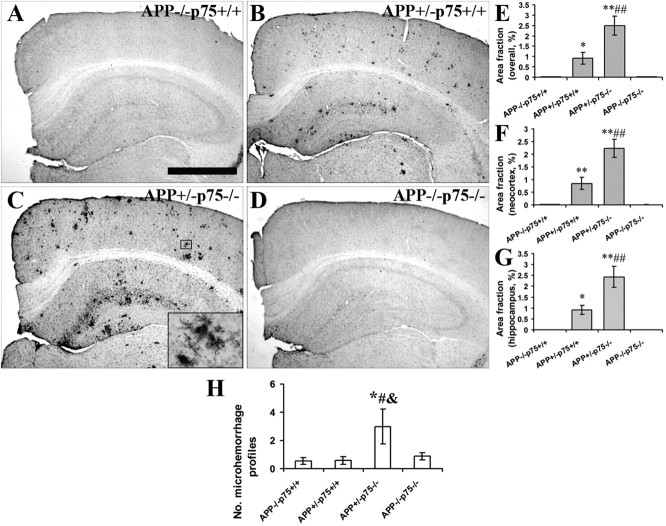
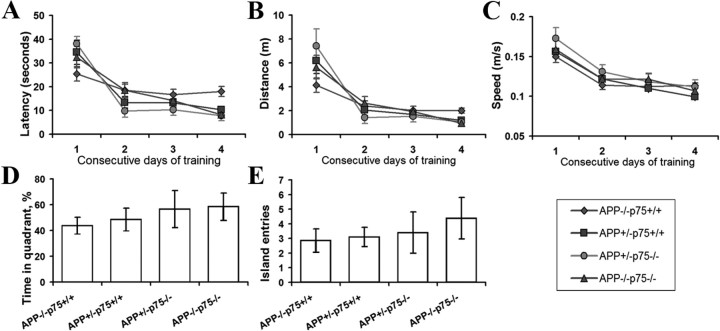
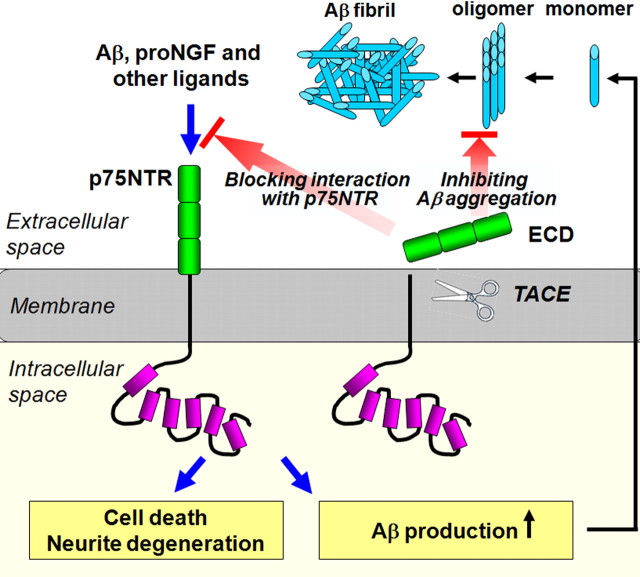
Accumulation of toxic amyloid-β (Aβ) in the cerebral cortex and hippocampus is a major pathological feature of Alzheimer's disease (AD). The neurotrophin receptor p75NTR has been proposed to mediate Aβ-induced neurotoxicity; however, its role in the development of AD remains to be clarified. The p75NTR/ExonIII-/- mice and APPSwe/PS1dE9 mice were crossed to generate transgenic AD mice with deletion of p75NTR gene. In APPSwe/PS1dE9 transgenic mice, p75NTR expression was localized in the basal forebrain neurons and degenerative neurites in neocortex, increased with aging, and further activated by Aβ accumulation. Deletion of the p75NTR gene in APPSwe/PS1dE9 mice reduced soluble Aβ levels in the brain and serum, but increased the accumulation of insoluble Aβ and Aβ plaque formation. There was no change in the levels of amyloid precursor protein (APP) and its proteolytic derivatives, or α-, β-, and γ-secretase activities, or in levels of BACE1, neprilysin (NEP), and insulin-degrading enzyme (IDE) proteins. Aβ production by cortical neurons of APPSwe/PS1dE9 mice was reduced by deletion of p75NTR gene in vitro. Recombinant extracellular domain of p75NTR attenuated the oligomerization and fibrillation of synthetic Aβ(42) peptide in vitro, and reduced local Aβ plaques after hippocampus injection in vivo. In addition, deletion of p75NTR attenuated microgliosis but increased the microhemorrhage profiles in the brain. The deletion of p75NTR did not significantly change the cognitive function of the mice up to the age of 9 months. Our data suggest that p75NTR plays a critical role in regulating Aβ levels by both increasing Aβ production and attenuating its aggregation, and they caution that a therapeutic intervention simply reducing p75NTR may exacerbate AD pathology.


Figures

Figure 1.
Figure 1.
Expression of p75NTR in the brain. p75NTR expression in the brain was measured by Western blot and immunohistochemistry (n = 10 in each group). A, Brain homogenates of APPSwe/PS1dE9 mice and their wild-type littermates at 3, 6, and 9 months of age were subjected to Western blot analysis probed with rabbit anti-p75NTR polyclonal antibody (G3231) and monoclonal antibody to β-actin. B, Sections of basal forebrain, frontal lobe, and hippocampus from 9-month-old APPSwe/PS1dE9 mice and their wild-type littermates were stained using free-floating immunohistochemistry for p75NTR with rabbit anti-p75NTR polyclonal antibody (Ab9650). C, Representative confocal images for colocalization of p75NTR-positive fibers and fibrillar plaques in brain of 9-month-old APPSwe/PS1dE9 mice, with Ab 9650 for p75NTR (arrowheads), N52 for neurofilament 200 (NF200, arrows), and thioflavine S for fibrillar plaque.
Figure 2.
Figure 2.
Aβ plaque burden in the brain of mice with different genotypes. A series of five equally spaced tissue sections (∼1.3 mm apart) spanning the whole brain were stained using free-floating immunohistochemistry for total Aβ plaque, or using Congo red staining for compact Aβ plaque (n = 10 in each group). A–C, Congo red-positive Aβ plaques in frontal lobe of 9-month-old APP+/−p75+/+, APP+/−p75+/−, and APP+/−p75−/− mice. D–F, Congo red-positive Aβ plaques in hippocampus of 9-month-old APP+/− p75+/+, APP+/−p75+/−, and APP+/−p75−/− mice. G–H, Comparison of Congo red-positive Aβ plaque density (G), average size (H), and area fraction (I) in neocortex and hippocampus of 9-month-old animals. J–L, IHC-positive Aβ plaques in frontal lobe of 9-month-old APP+/−p75+/+, APP+/−p75+/−, and APP+/−p75−/− mice. M–Q, IHC-positive Aβ plaques in hippocampus of 9-month-old APP+/−p75+/+, APP+/−p75+/−, and APP+/−p75−/− mice. P–R, Comparison of IHC-positive Aβ plaque density (P), average size (Q), and area fraction (R) in neocortex and hippocampus of 9-month-old animals. S, T, Comparison of Congo red-positive Aβ plaque density in the brains of 3- (S) and 6- (T) month-old animals. * and ** denote p < 0.05 or p < 0.01 versus APP+/−p75+/+. Scale bar, 1 mm.
Figure 3.
Figure 3.
Aβ levels in the brain and Aβ productions in vitro. A–C, Comparison of Aβ in TBS, SDS, and FA and total Aβ, Αβ40, and Αβ42 among groups at 3, 6, and 9 months of age (n = 10 in each group). Aβ in the brain was extracted sequentially in TBS, 2% SDS, and 70% FA water solution. Aβ peptide concentrations in the brain of animals were measured by ELISA. D–F, Comparison of total Aβ, Aβ40, and Aβ42 in serum at 3, 6, and 9 months of age. Aβ peptide concentrations in the serum of animals were measured by ELISA. G–H, Aβ production of cortical neurons in vitro. The cortex of 1-month-old female APP+/−p75+/+ and APP+/−p75−/− mice was isolated and cultured at 2.5 × 10⁵/ml in Neurobasal A/B27 with 0.5 mm glutamine, 5 ng/ml bFGF, 10,000 U/ml penicillin, and 1 mg/ml streptomycin in triplicate. Both culture medium and cell lysate prepared in RIPA buffer were collected after culture for 3 (G) and 5 (H) days and measured for Aβ by ELISA. * and ** denote p < 0.05 or p < 0.01 versus APP+/−p75+/+ mice.
Figure 4.
Figure 4.
APP proteolytic processing, secretase activities, and Aβ-degrading enzymes. A, APP expression and proteolytic processing. Western blot analyses were performed to detect the APP expression and APP proteolytic derivates in the brain homogenates of 9-month-old animals using antibodies directed to APPfl, APPα, APPβ, CTFα, and CTFβ. “−” denotes APP+/−p75−/− mice, and “+” denotes APP+/−/p75+/+ mice. B, Secretase activities and BACE1 expression. Shown are α-, β-, and γ-secretase activities in the brain of 9-month-old APP+/−p75+/+ and APP+/−p75−/− mice, which were measured with secretase-specific peptides conjugated to the reporter molecules EDANS and DABCYL. Cleavage of the peptide by the secretase physically separates the EDANS and DABCYL, allowing for the release of a fluorescent signal, which is proportional to the level of secretase enzymatic activity. The protein levels of BACE1 in the brain of APP+/−p75+/+ and APP+/−p75−/− mice were measured by Western blot analysis probed with anti-BACE1 monoclonal antibody. C, Levels of NEP and IDE in the brain. The protein levels of NEP and IDE in the brain homogenates of 9-month-old APP+/−p75+/+ and APP+/−p75−/− mice were measured by Western blot analysis with antibodies directed to NEP and IDE. n = 10 in each group.
Figure 5.
Figure 5.
Extracellular domain of p75NTR attenuates Aβ aggregation. A, Dose-dependent inhibition of Aβ oligomerization by p75/Fc in vitro. Aβ42 (final concentration 20 μm) was incubated with p75/Fc at various molar ratios (1:0.01, 1:0.1, and 1:0.5) or HuIgG (molar ratio, 1:0.5) at 4°C for 24 h. “Aβ non-incubated” is the control Aβ42 peptide without incubation at 4°C for 24 h. “Aβ incubated” is the control Aβ42 peptide (final concentration 20 μm) that was incubated alone at 4°C for 24 h. Bands were visualized by Western blot analysis probed with biotin-conjugated 6E10 antibody. B, Inhibition of Aβ fibrillation by p75/Fc. Twenty-five micromolar Aβ42 peptide (30 μg) was incubated with 12.5 μm p75/Fc or HuIgG in DMEM containing 10 mm HCl at 37°C for 24 h. The same amount of Aβ42 was incubated alone under the same conditions as control. The Aβ fibrils were measured by ThT assay. C, Disaggregation of preformed Aβ fibrils by p75/Fc. Twenty-five micromolar Aβ42 (30 μg) was incubated at a concentration of at 37°C for 1 d to generate fibrils. Preformed fibrils were then incubated with the 12.5 μm p75/Fc or HuIgG for an additional 3 d at 37°C. Aβ42 was incubated alone under the same conditions, along with the experiment as control. The Aβ fibrils were measured by ThT assay. D–L, Electron micrographs showing morphology of Aβ assembly in the presence or absence of p75/Fc. D–F, Aβ oligomerization. Aβ42 was incubated alone (D) or with p75/Fc (E) or HuIgG (F) at 4°C for 24 h. G–I, Aβ fibrillation. Aβ42 was incubated alone (G) or with p75/Fc (H) or HuIgG (I) at 37°C for 24 h. J–L, Disaggregation of Aβ fibrils. Preformed Aβ was incubated alone (J) or with p75/Fc (K) or HuIgG (L) at 37°C for an additional 3 d. Scale bar, 500 nm.
Figure 6.
Figure 6.
Hippocampus injection of p75/Fc reduces local Aβ plaques. p75/Fc (3 μg in 3 μl) or HuIgG (6 μg in 3 μl, the equivalent molar to p75/Fc) were injected into the left hippocampus of 9-month-old APPSwe/PS1dE9 mice (n = 4 in each group). One week after injection, Aβ plaques in hippocampus were stained using biotin-conjugated 6E10 antibody and quantified. The area fraction of Aβ plaque in hippocampus of the injection side was normalized with the control side. A, Distribution and diffusion of p75/Fc 24 h after injection in the left hippocampus. Sections were stained with antibody to Fc of human IgG. B, C, Representative images of hippocampus Aβ plaque staining 7 d after injection of p75/Fc (B) or HuIgG (C) into the hippocampus of 9-month-old APPSwe/PS1 mice. D, Comparison of Aβ plaque burden in hippocampus between p75/Fc and HuIgG injection groups. E, Expression of p75NTR extracellular domain (ECD) in the brain of wild-type and APPSwe/PS1dE9 mice at age of 9 months. To see the diffusion of injected p75/Fc in the hippocampus, three mice were killed 24 h after injection and brain sections were stained against Fc fragment of human IgG. Extensive diffusion of the protein was observed in the injected hippocampus, whereas little protein diffused into the contralateral hippocampus (arrow). * denotes p < 0.05.
Figure 7.
Figure 7.
Microgliosis and microhemorrhage in the brain of animals with different genotypes. A series of five equally spaced tissue sections spanning the brain were stained using free-floating immunohistochemistry for activated microglia (n = 10 in each group). A–D, Representative images of staining in APP−/−p75+/+ (A), APP+/−p75+/+ (B), APP+/−p75−/− (C), and APP−/−p75−/− (D) mice. No obvious microgliosis was observed in the brain of APP−/−p75+/+ and APP−/−p75−/− mice. E, Comparison of CD45 area fraction in neocortex and hippocampus among groups. F, Comparison of CD45 area fraction in neocortex. G, Comparison of CD45 area fraction in hippocampus. H, Comparison of microhemorrhage profile among mice with different genotypes. * and ** denote p < 0.05 or p < 0.01 versus APP−/−p75+/+ mice, # and ## denote p < 0.05 or p < 0.01 versus APP+/−p75+/+ mice, and & and && denote p < 0.05 or p < 0.01 versus APP−/−p75−/− mice, as determined by one-way ANOVA. Scale bar, 1 mm.
Figure 8.
Figure 8.
Deletion of p75NTR does not lessen memory deficits until 9 months of age. Nine-month-old animals were subjected to Morris water maze test for a consecutive 5 d (n = 10 in each group). A, Latency taken to escape from the water in the platform trials. B, Distance taken to escape from the water in the platform trials. C, Swimming speed during the consecutive days of training. D, The number of crosses over the exact location of the hidden platform in the probe trial. E, Percentage of time spent in the quadrant area relative to the total time spent in the pool in the probe trial. The results are means ± SEM.
Figure 9.
Figure 9.
Schematic diagram depicting functions of p75NTR in Aβ metabolism. p75NTR may have two-sided effects on Aβ metabolism. On one hand, p75NTR signaling may increase Aβ production and enhance steady-state levels of Aβ, which may increase AD pathology. In addition to Aβ production, p75NTR also mediates Aβ and proNGF-mediated neurotoxicity such as neuron death and neurite degeneration. On the other hand, the extracellular domain of p75NTR after shedding from the membrane may bind and sequester Aβ, and thus suppress Aβ aggregation and reduce Aβ deposition in the brain. Meanwhile, the extracellular domain of p75NTR may also block the interaction of p75NTR and its ligands (e.g., Aβ or proNGF) by competitive binding, and thus attenuate the p75NTR signaling that leads to the neurotoxicity. ECD denotes extracellular domain of p75NTR.

Similar articles

Cited by

References

    1. Ahmed Z, Mazibrada G, Seabright RJ, Dent RG, Berry M, Logan A. TACE-induced cleavage of NgR and p75NTR in dorsal root ganglion cultures disinhibits outgrowth and promotes branching of neurites in the presence of inhibitory CNS myelin. FASEB J. 2006;20:1939–1941. - PubMed
    1. Barrett GL, Reid CA, Tsafoulis C, Zhu W, Williams DA, Paolini AG, Trieu J, Murphy M. Enhanced spatial memory and hippocampal long-term potentiation in p75 neurotrophin receptor knockout mice. Hippocampus. 2010;20:145–152. - PubMed
    1. Bengoechea TG, Chen Z, O'Leary DA, Masliah E, Lee KF. p75 reduces beta-amyloid-induced sympathetic innervation deficits in an Alzheimer's disease mouse model. Proc Natl Acad Sci U S A. 2009;106:7870–7875. - PMC - PubMed
    1. Bronfman FC. Metalloproteases and gamma-secretase: new membrane partners regulating p75 neurotrophin receptor signaling? J Neurochem. 2007;103(Suppl 1):91–100. - PubMed
    1. Buxbaum JD, Gandy SE, Cicchetti P, Ehrlich ME, Czernik AJ, Fracasso RP, Ramabhadran TV, Unterbeck AJ, Greengard P. Processing of Alzheimer beta/A4 amyloid precursor protein: modulation by agents that regulate protein phosphorylation. Proc Natl Acad Sci U S A. 1990;87:6003–6006. - PMC - PubMed

Publication types

MeSH terms

LinkOut - more resources