Neem leaf glycoprotein partially rectifies suppressed dendritic cell functions and associated T cell efficacy in patients with stage IIIB cervical cancer
- PMID: 21307275
- PMCID: PMC3122582
- DOI: 10.1128/CVI.00499-10
Neem leaf glycoprotein partially rectifies suppressed dendritic cell functions and associated T cell efficacy in patients with stage IIIB cervical cancer
Abstract
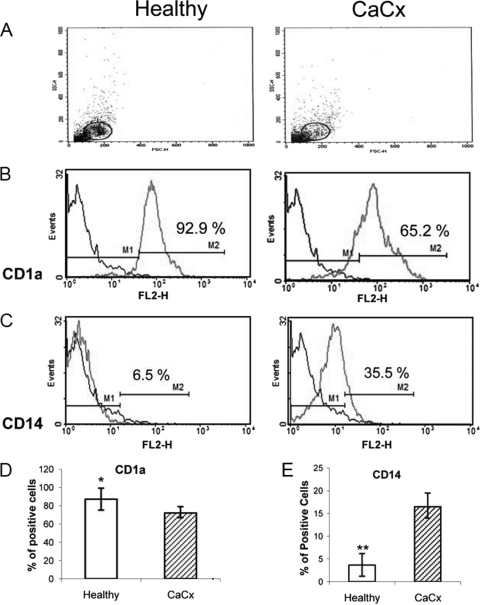
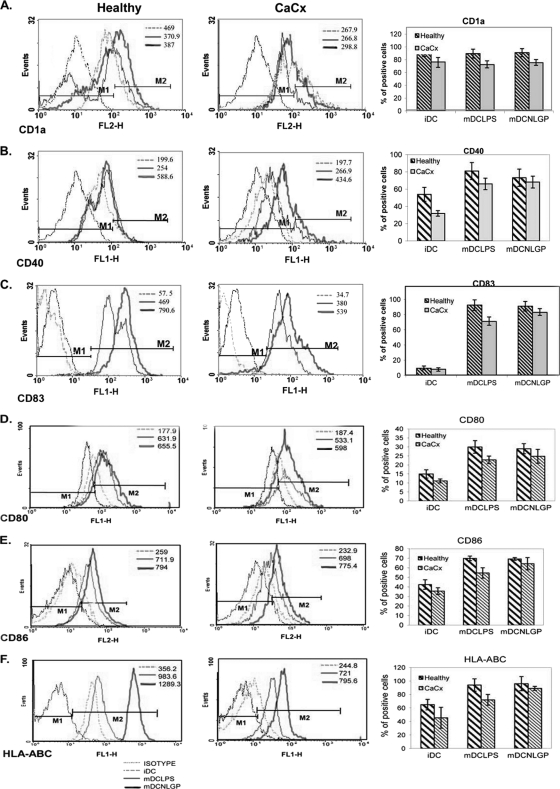
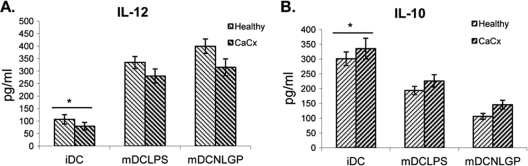
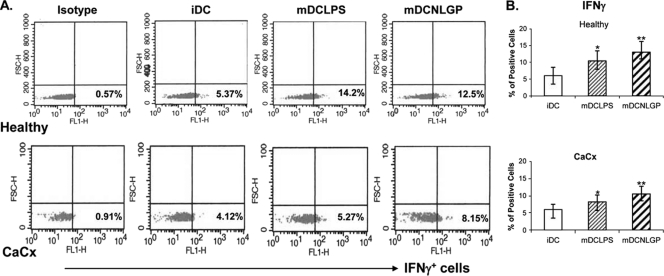
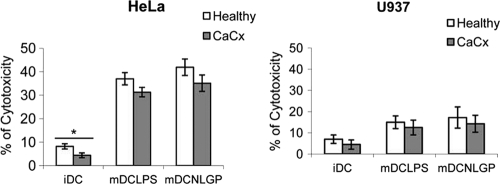
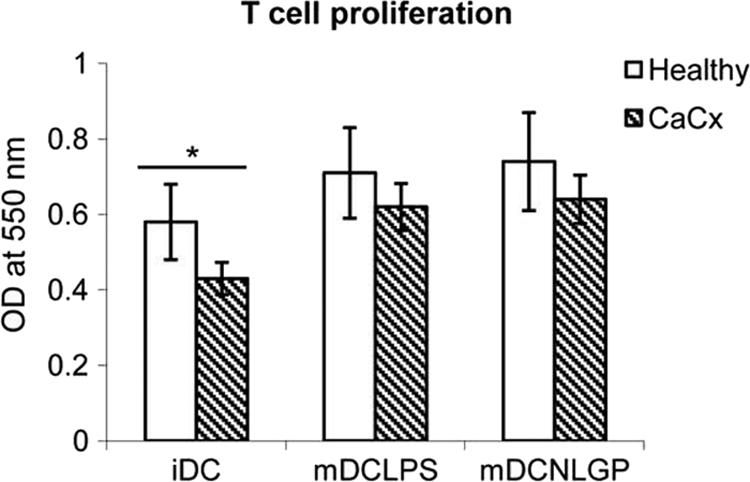
Myeloid-derived dendritic cells (DCs) generated from monocytes obtained from stage IIIB cervical cancer (CaCx IIIB) patients show dysfunctional maturation; thus, antitumor T cell functions are dysregulated. In an objective to optimize these dysregulated immune functions, the present study is focused on the ability of neem leaf glycoprotein (NLGP), a nontoxic preparation of the neem leaf, to induce optimum maturation of dendritic cells from CaCx IIIB patients. In vitro NLGP treatment of immature DCs (iDCs) obtained from CaCx IIIB patients results in upregulated expression of various cell surface markers (CD40, CD83, CD80, CD86, and HLA-ABC), which indicates DC maturation. Consequently, NLGP-matured DCs displayed balanced cytokine secretions, with type 1 bias and noteworthy functional properties. These DCs displayed substantial T cell allostimulatory capacity and promoted the generation of cytotoxic T lymphocytes (CTLs). Although NLGP-matured DCs derived from CaCx monocytes are generally subdued compared to those with a healthy monocyte origin, considerable revival of the suppressed DC-based immune functions is noted in vitro at a fairly advanced stage of CaCx, and thus, further exploration of ex vivo and in vivo DC-based vaccines is proposed. Moreover, the DC maturating efficacy of NLGP might be much more effective in the earlier stages of CaCx, where the extent of immune dysregulation is less and, thus, the scope of further investigation may be explored.
Figures
Similar articles
-
Neem leaf glycoprotein overcomes indoleamine 2,3 dioxygenase mediated tolerance in dendritic cells by attenuating hyperactive regulatory T cells in cervical cancer stage IIIB patients.Hum Immunol. 2013 Aug;74(8):1015-23. doi: 10.1016/j.humimm.2013.04.022. Epub 2013 Apr 27. Hum Immunol. 2013. PMID: 23628394
-
Neem leaf glycoprotein matures myeloid derived dendritic cells and optimizes anti-tumor T cell functions.Vaccine. 2010 Feb 3;28(5):1241-52. doi: 10.1016/j.vaccine.2009.11.018. Epub 2009 Dec 5. Vaccine. 2010. PMID: 19969119
-
NLGP counterbalances the immunosuppressive effect of tumor-associated mesenchymal stem cells to restore effector T cell functions.Stem Cell Res Ther. 2019 Sep 23;10(1):296. doi: 10.1186/s13287-019-1349-z. Stem Cell Res Ther. 2019. PMID: 31547863 Free PMC article.
-
Neem Leaf Glycoprotein in immunoregulation of cancer.Hum Immunol. 2022 Nov;83(11):768-777. doi: 10.1016/j.humimm.2022.08.012. Epub 2022 Aug 31. Hum Immunol. 2022. PMID: 36055899 Review.
-
Dendritic cell gene therapy.Surg Oncol Clin N Am. 2002 Jul;11(3):645-60. doi: 10.1016/s1055-3207(02)00027-3. Surg Oncol Clin N Am. 2002. PMID: 12487060 Review.
Cited by
-
Exploring the therapeutic potential of Neem (Azadirachta Indica) for the treatment of prostate cancer: a literature review.Ann Transl Med. 2022 Jul;10(13):754. doi: 10.21037/atm-22-94. Ann Transl Med. 2022. PMID: 35957716 Free PMC article. Review.
-
Neem leaf glycoprotein activates CD8(+) T cells to promote therapeutic anti-tumor immunity inhibiting the growth of mouse sarcoma.PLoS One. 2013;8(1):e47434. doi: 10.1371/journal.pone.0047434. Epub 2013 Jan 11. PLoS One. 2013. PMID: 23326300 Free PMC article.
-
Neem leaf glycoprotein prophylaxis transduces immune dependent stop signal for tumor angiogenic switch within tumor microenvironment.PLoS One. 2014 Nov 12;9(11):e110040. doi: 10.1371/journal.pone.0110040. eCollection 2014. PLoS One. 2014. PMID: 25391149 Free PMC article.
-
Neem components as potential agents for cancer prevention and treatment.Biochim Biophys Acta. 2014 Aug;1846(1):247-57. doi: 10.1016/j.bbcan.2014.07.002. Epub 2014 Jul 10. Biochim Biophys Acta. 2014. PMID: 25016141 Free PMC article. Review.
-
Exploring the role of Azadirachta indica (neem) and its active compounds in the regulation of biological pathways: an update on molecular approach.3 Biotech. 2021 Apr;11(4):178. doi: 10.1007/s13205-021-02745-4. Epub 2021 Mar 20. 3 Biotech. 2021. PMID: 33927969 Free PMC article. Review.
References
-
- Almand B., et al. 2000. Clinical significance of defective dendritic cell differentiation in cancer. Clin. Cancer Res. 6:1755–1766 - PubMed
-
- Baral R. N., Sarkar K., Mandal-Ghosh I., Bose A. 2010. Relevance of neem leaf glycoprotein as a new vaccine adjuvant for cancer immunotherapy, p. 21–45 In Gupta V. K. (ed.), Research in bioactive natural products. Studium Press LLC, Houston, TX
MeSH terms
Substances
LinkOut - more resources
Full Text Sources
Medical
Research Materials