. 2011 Feb;23(2):600-27.
doi: 10.1105/tpc.110.081224. Epub 2011 Feb 9.

Antisense inhibition of the iron-sulphur subunit of succinate dehydrogenase enhances photosynthesis and growth in tomato via an organic acid-mediated effect on stomatal aperture

Affiliations

Antisense inhibition of the iron-sulphur subunit of succinate dehydrogenase enhances photosynthesis and growth in tomato via an organic acid-mediated effect on stomatal aperture

Wagner L Araújo et al. Plant Cell. 2011 Feb.

Abstract

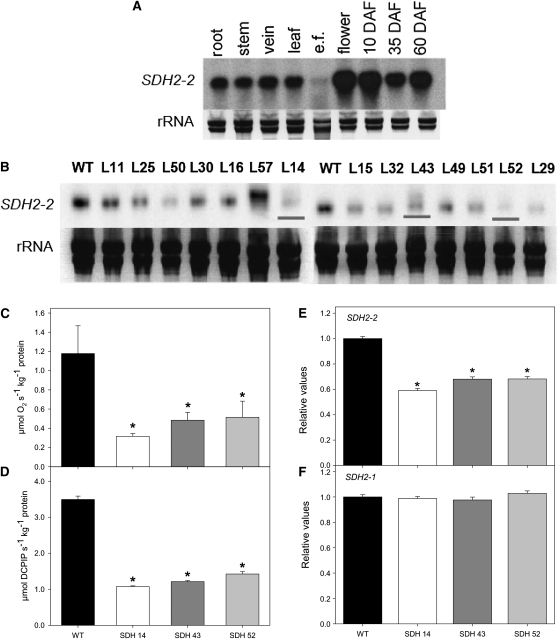
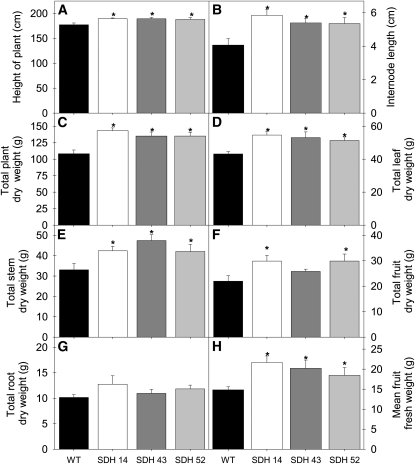
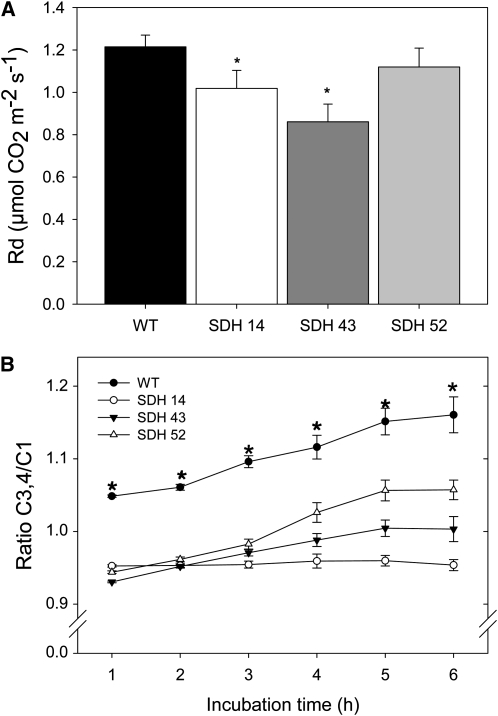
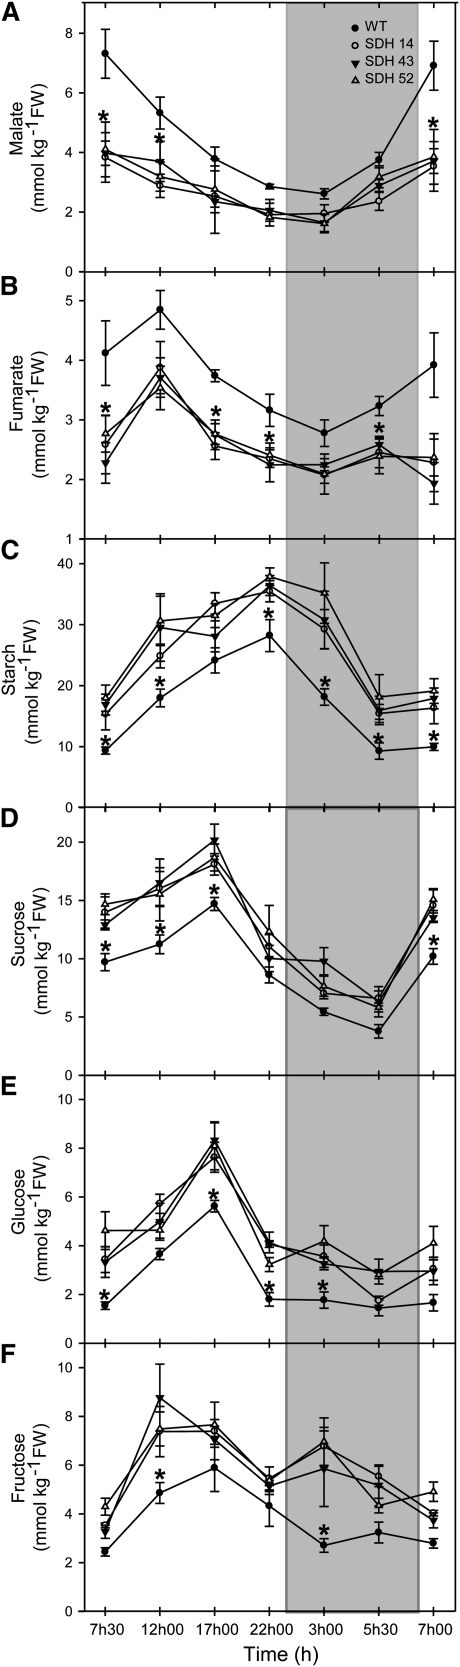
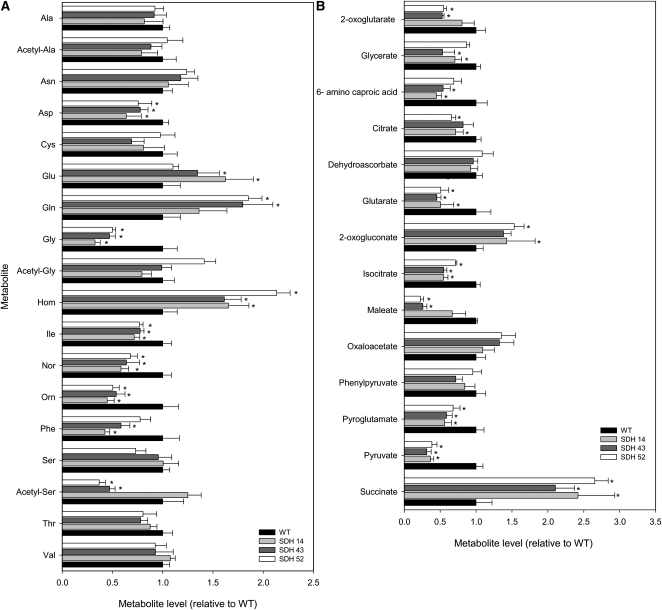
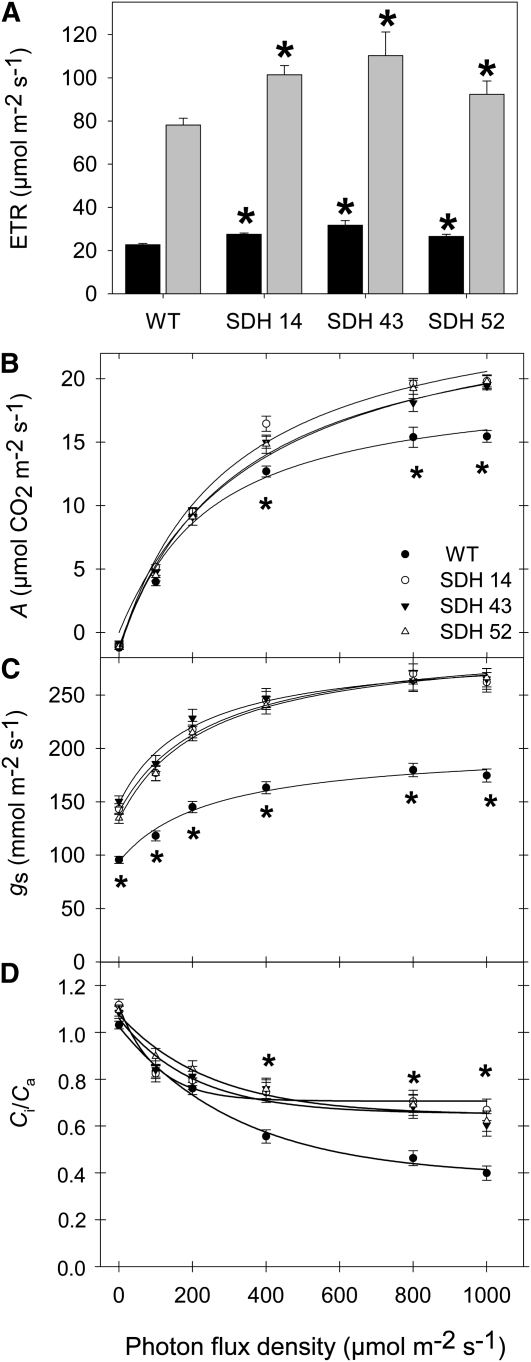
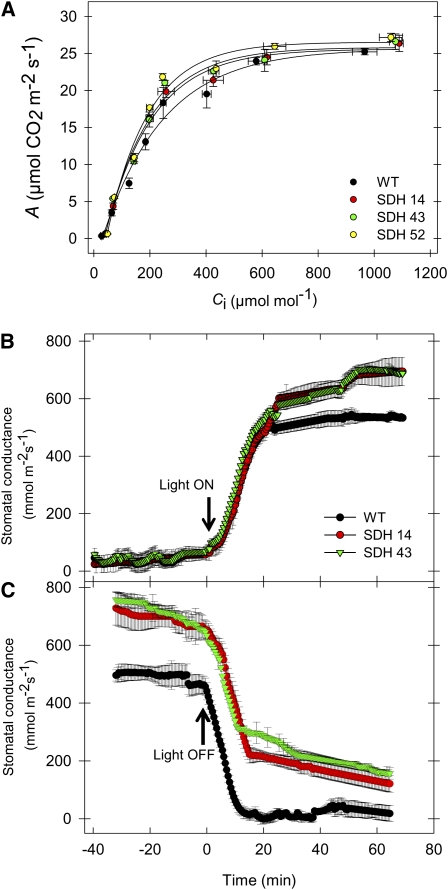
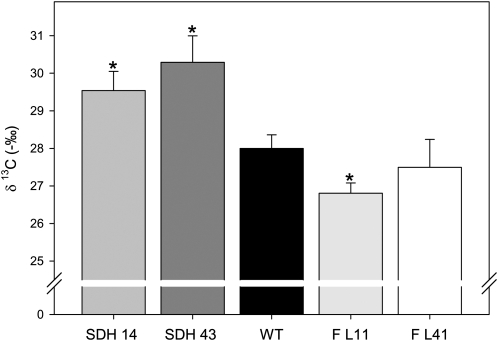
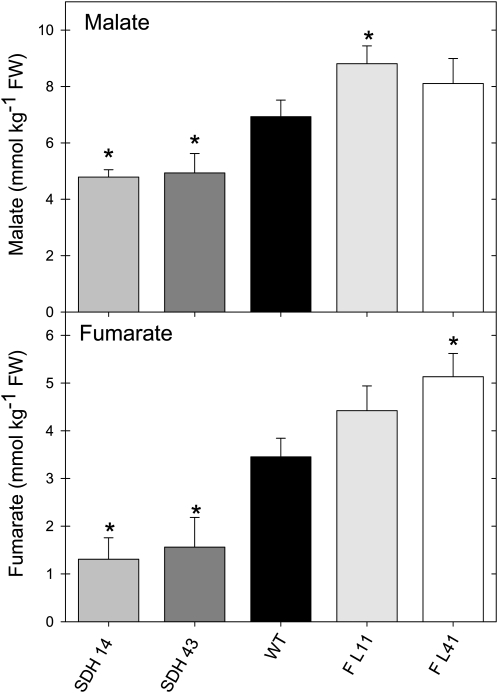
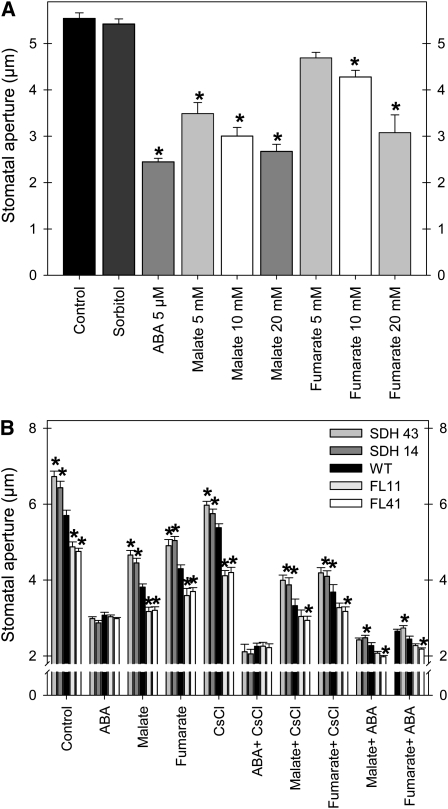
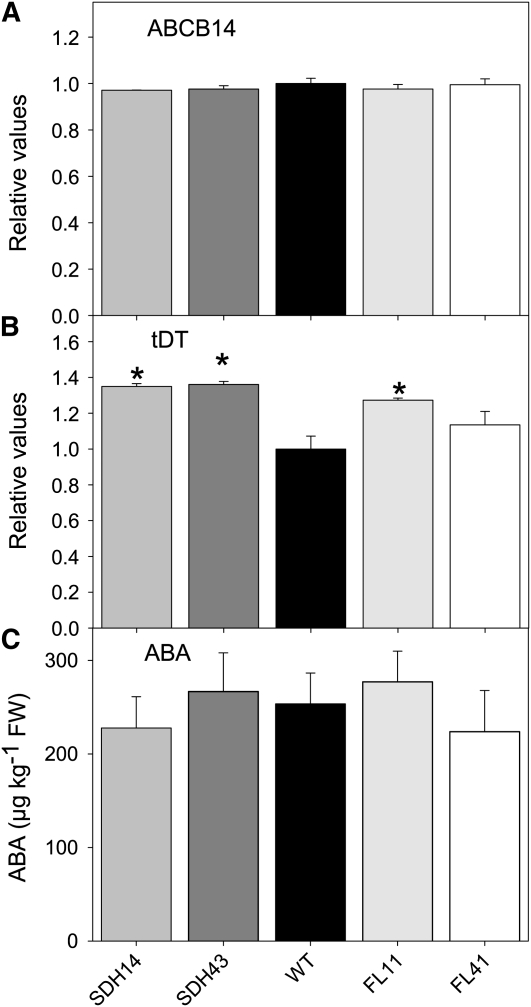
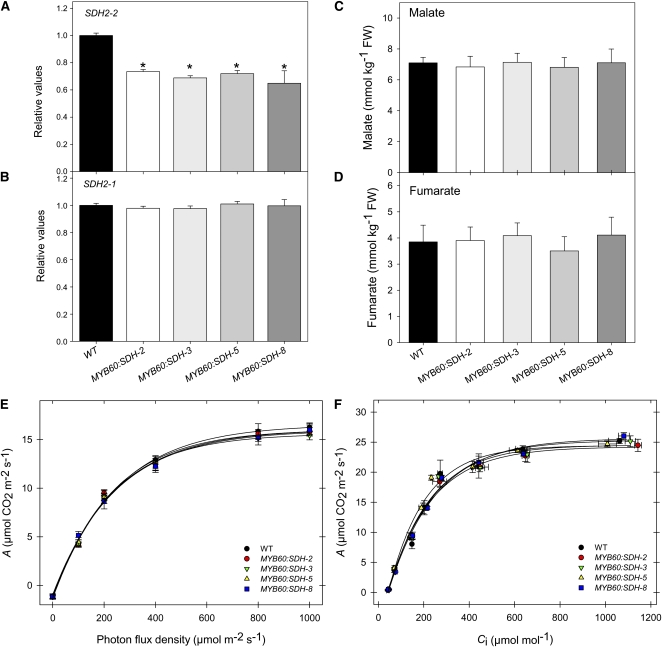
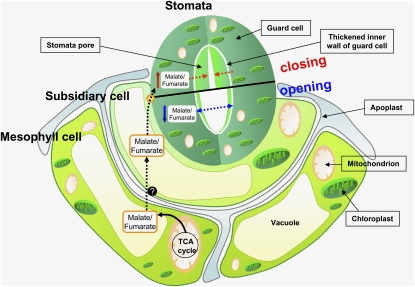
Transgenic tomato (Solanum lycopersicum) plants expressing a fragment of the Sl SDH2-2 gene encoding the iron sulfur subunit of the succinate dehydrogenase protein complex in the antisense orientation under the control of the 35S promoter exhibit an enhanced rate of photosynthesis. The rate of the tricarboxylic acid (TCA) cycle was reduced in these transformants, and there were changes in the levels of metabolites associated with the TCA cycle. Furthermore, in comparison to wild-type plants, carbon dioxide assimilation was enhanced by up to 25% in the transgenic plants under ambient conditions, and mature plants were characterized by an increased biomass. Analysis of additional photosynthetic parameters revealed that the rate of transpiration and stomatal conductance were markedly elevated in the transgenic plants. The transformants displayed a strongly enhanced assimilation rate under both ambient and suboptimal environmental conditions, as well as an elevated maximal stomatal aperture. By contrast, when the Sl SDH2-2 gene was repressed by antisense RNA in a guard cell-specific manner, changes in neither stomatal aperture nor photosynthesis were observed. The data obtained are discussed in the context of the role of TCA cycle intermediates both generally with respect to photosynthetic metabolism and specifically with respect to their role in the regulation of stomatal aperture.


Figures

Figure 1.
Figure 1.
Characterization and Expression of Tomato Succinate Dehydrogenase (SDH2-2). (A) RNA gel blot containing total RNA extracted from different organs of tomato plants. Total RNA was obtained from root, stem, vein, leaf, epidermal fragments (e.f.), flowers, and fruits 10, 35, and 60 d after flowering (DAF). (B) RNA gel blot analysis of leaves of 4-week-old transgenic tomato plants with altered expression of SDH2-2 compared with the wild type (WT). The full-length 825-bp cDNA encoding the iron-sulfur subunit of succinate dehydrogenase was cloned in the antisense orientation into the transformation vector pK2WG7 between the CaMV promoter and the ocs terminator (see Supplemental Figure 1B online), and 15 transgenic tomato plants were obtained. Screening of the lines (L) by RNA gel blot yielded three lines that displayed a considerable reduction of Sl SDH2-2 (shown in red lines). (C) and (D) Succinate-dependent oxygen consumption in freshly isolated mitochondria of green fruits 35 DAF (C) and succinate-dependent DCPIP reduction determined in enriched mitochondria from tomato leaves (D). Data are presented as mean values ± se and are averages from three to five different mitochondrial isolations. (E) and (F) Relative transcript abundance of mitochondrial Complex II subunits (SDH2-2 and SDH2-1, respectively). The abundance of SDH mRNAs was measured by qRT-PCR, and values are presented as mean ± se of six individual plants per line. Asterisks indicate values that were determined by the Student’s t test to be significantly different from the wild type (P < 0.05).
Figure 2.
Figure 2.
Growth Phenotype of 10-Week-Old Antisense Succinate Dehydrogenase Tomato Plants. Transgenic plants showed an enhanced aerial biomass with respect to the wild type in the later stages of growth. Height of plant (A); internode length (B); total plant dry weight (C); total leaf dry weight (D); total stem dry weight (E); total fruit dry weight (F); total root dry weight (G); and mean fruit weight (H). The lines used were as follows: the wild type (WT), black bars; SDH14, white bars; SDH43, dark-gray bars; SDH52, light-gray bars. Values are presented as means ± se of six individual plants per line; an asterisk indicates values that were determined by the Student’s t test to be significantly different (P < 0.05) from the wild type.
Figure 3.
Figure 3.
Respiratory Parameters in Leaves of Antisense Succinate Dehydrogenase Tomato Plants. (A) Dark respiration measurements performed in 4- to 5-week-old plants. WT, wild type. (B) Ratio of carbon dioxide evolution from C3,4 to C1 positions of glucose in leaves of antisense SDH tomato plants. The leaf discs were taken from 4-week-old plants and were incubated in 10 mM MES-KOH solution, pH 6.5, 0.3 mM glucose supplemented with 2.32 kBq mL−1 of [1-14C]- or [3,4-14C]-glucose at an irradiance of 200 μmol m−2 s−1. The 14CO2 liberated was captured (at hourly intervals) in a KOH trap, and the amount of radiolabel released was subsequently quantified by liquid scintillation counting. Values are presented as means ± se of determinations on six individual plants per line. An asterisk indicates values that were determined by the Student’s t test to be significantly different (P < 0.05) from the wild type.
Figure 4.
Figure 4.
Diurnal Changes in Key Metabolite Content in Leaves of Antisense Succinate Dehydrogenase Tomato Plants. Malate (A), fumarate (B), starch (C), sucrose (D), glucose (E), and fructose (F) were measured at each time point. Samples were taken from mature source leaves. The lines used were as follows: the wild type (WT), black circles; SDH14, open circles; SDH43, black triangles; SDH52, open triangles. The data presented are means ± se of measurements from six individual plants per line; an asterisk indicates values that were determined by the Student’s t test to be significantly different (P < 0.05) from the wild type. Gray bars indicate the dark period; white bars indicate the light period. FW, fresh weight.
Figure 5.
Figure 5.
Relative Metabolite Content of the Fully Expanded Leaves of Antisense Succinate Dehydrogenase Tomato Plants. Amino acids (A) and organic acids (B) were determined as described in Methods. The full data sets from these metabolic profiling studies are available in Supplemental Table 2 online. Data are normalized with respect to the mean response calculated for the wild type (to allow statistical assessment, individual plants from this set were normalized in the same way). The lines used were as follows: the wild type (WT), black bars; SDH14, gray bars; SDH43, dark gray bars; SDH52, white bars. Values are presented as means ± se of six individual plants per line; an asterisk indicates values that were determined by the Student’s t test to be significantly different (P < 0.05) from the wild type.
Figure 6.
Figure 6.
Effect of Decreased Mitochondrial Succinate Dehydrogenase Activity on Photosynthetic Parameters. (A) In vivo chlorophyll a fluorescence was measured as an indicator of the ETR using a PAM fluorometer at PFD of 100 (black bars) and 700 (gray bars) μmol m−2 s−1. (B) Assimilation rate (A) as a function of PFD intensities. (C) Stomatal conductance (gs) as a function of the intensity of PFD. (D) Internal-to-ambient CO2 concentration ratio (Ci/Ca) as a function of the intensity of PFD. Values are presented as means ± se of six individual determinations per line. All measurements were performed in 4- to 5-week-old plants. The lines used were as follows: the wild type (WT), black circles; SDH14, white circles; SDH43, black triangles; SDH52, white triangles. An asterisk indicates values that were determined by the Student's t test to be significantly different (P < 0.05) from the wild type.
Figure 7.
Figure 7.
Effect of Decreased Mitochondrial Succinate Dehydrogenase Activity on Photosynthetic Parameters. (A) Rate of net CO2 assimilation as a function of internal leaf CO2 concentration (Ci). WT, wild type. (B) and (C) Time taken for stomatal opening following a dark-to-light transition (B) and time taken for stomatal closure following a light-to-dark transition (C). Values are presented as means ± se of six individual determinations per line. All measurements were performed in 4- to 5-week-old plants.
Figure 8.
Figure 8.
Carbon Isotope Composition Ratio (δ13C) from Leaves of Wild-Type, Succinate Dehydrogenase, and Fumarase Antisense Lines. Values are presented as means ± se of six individual determinations per line. All measurements were performed in 4-week-old plants. The lines used were as follows: the wild type (WT), black bars; SDH14, gray bars; SDH43, dark-gray bars; FL11, light-gray bars, FL41, white bars. An asterisk indicates values that were determined by the Student’s t test to be significantly different (P < 0.05) from the wild type.
Figure 9.
Figure 9.
Apoplastic Concentrations of Malate and Fumarate in Succinate Dehydrogenase and Fumarase Antisense Lines. The apoplastic concentrations of malate (A) and fumarate (B) were determined as described in Methods. Values are presented as means ± se of six individual determinations per line. All measurements were performed in 4- to 5-week-old plants. The lines used were as follows: the wild type (WT), black bars; SDH14, gray bars; SDH43, dark-gray bars; FL11, light-gray bars; FL41, white bars. An asterisk indicates values that were determined by the Student’s t test to be significantly different (P < 0.05) from the wild type. FW, fresh weight.
Figure 10.
Figure 10.
Stomatal Movement in the Presence of Malate or Fumarate and in Combination with ABA and the Channel Blocker CsCl. (A) The effects of malate and fumarate concentrations on stomatal closing of leaves of wild-type plants. For control treatments, we used the stomatal opening buffer and, additionally, 20 mM sorbitol. (B) Effects of malate and fumarate alone and in combination with ABA and CsCl on transgenic plants. Detached leaves were floated on stomatal opening buffer (10 mM MES-KOH, pH 6.15, 5 mM KCl, and 50 μM CaCl2) under illumination for 2 h to induce stomatal opening and then treated with different malate and fumarate concentrations for an additional hour (A) or with either 20 mM malate, 20 mM fumarate, 20 mM CsCl, or 5 μM ABA and the combinations shown in (B) for an additional hour. Thereafter, stomatal apertures were measured. Data are mean ± se of at least 120 stomata obtained from three independent experiments with comparable results. The lines used were as follows: the wild type (WT), black bars; SDH14, dark-gray bars; SDH43, gray bars; FL11, light-gray bars; FL41, white bars. An asterisk indicates values that were determined by the Student’s t test to be significantly different (P < 0.05) from the wild type or the corresponding control.
Figure 11.
Figure 11.
Expression of Malate Transporters and Measurements of ABA Levels. qRT-PCR analysis of the expression of ABCB14 (A) and the tonoplast dicarboxylate transporter (tDT) (B) and ABA analyses (C) in leaves of the wild-type and transgenic lines. All measurements were performed on 4-week-old plants. Values are presented as means ± se of six individual determinations per line. The lines used were as follows: the wild type (WT), black bars; SDH14, gray bars; SDH43, dark-gray bars; FL11, light-gray bars; FL41, white bars. An asterisk indicates values that were determined by the Student’s t test to be significantly different (P < 0.05) from the wild type. FW, fresh weight.
Figure 12.
Figure 12.
Expression of Genes Involved in the Stomatal Response of the Wild Type in Succinate Dehydrogenase and Fumarase Antisense Lines. Light-responsive genes (A); ABA-responsive genes (B); signaling (C) and solute (D) transporter-related genes. The transcripts analyzed here were as follows: Rbcs, CCR2, PHOT1, PHOT2, CHX20, PLDα1, OST1, NIA2, CPK6, AHA2, ABI2, STP1, RBOHB, KAT2, CaS, TIP, GPCR1, GTG1, GPX3, and CIPK15. Analyses were done in epidermal fragments of fully expanded leaves of 4-week-old plants. Values are presented as means ± sd of six individual plants. The lines used were as follows: the wild type (WT), black bars; SDH14, gray bars; SDH43, dark-gray bars; FL11, light-gray bars; FL41, white bars. An asterisk indicates values determined by the Student’s t test to be significantly different (P < 0.05) from the wild type.
Figure 13.
Figure 13.
Physiological Characterization of SDH2-2 Lines under the Control of the Guard Cell–Specific Promoter MYB60. (A) and (B) Relative transcript abundance of mitochondrial Complex II subunits (SDH2-2 and SDH2-1, respectively). The abundance of SDH mRNAs was measured by quantitative RT-PCR. WT, wild type. (C) and (D) Apoplastic concentrations of malate (C) and fumarate (D). Malate and fumarate were determined as described in Methods. FW, fresh weight. (E) and (F) Assimilation rate as a function of PFD intensities (E) and net CO2 assimilation rate as a function of internal leaf CO2 concentration Ci (F). Values are presented as mean ± se of six individual plants per line. Asterisks indicate values that were determined by the Student’s t test to be significantly different from the wild type (P < 0.05).
Figure 14.
Figure 14.
Mitochondrial Function Triggers Stomatal Movement by Regulating Organic Acid Levels. The malate (fumarate) produced by the TCA cycle is transported to the vacuole, where it is stored. By an unclear mechanism, the level of organic acid is altered in the subsidiary cells, leading to an increased (decreased) concentration in the guard cells that culminates with the closing (opening) of stomata. Stomatal movement is additionally regulated by other well-characterized mechanisms (K+, ClABA, and Ca2+); therefore, future work is required to fully understand the molecular regulatory hierarchy of this highly specialized cell type.

References

    1. Abe H., Yamaguchi-Shinozaki K., Urao T., Iwasaki T., Hosokawa D., Shinozaki K. (1997). Role of Arabidopsis MYC and MYB homologs in drought- and abscisic acid-regulated gene expression. Plant Cell 9: 1859–1868 - PMC - PubMed
    1. Alba R., et al. (2004). ESTs, cDNA microarrays, and gene expression profiling: Tools for dissecting plant physiology and development. Plant J. 39: 697–714 - PubMed
    1. Araújo W.L., Ishizaki K., Nunes-Nesi A., Larson T.R., Tohge T., Krahnert I., Witt S., Obata T., Schauer N., Graham I.A., Leaver C.J., Fernie A.R. (2010). Identification of the 2-hydroxyglutarate and isovaleryl-CoA dehydrogenases as alternative electron donors linking lysine catabolism to the electron transport chain of Arabidopsis mitochondria. Plant Cell 22: 1549–1563 - PMC - PubMed
    1. Araújo W.L., Nunes-Nesi A., Trenkamp S., Bunik V.I., Fernie A.R. (2008). Inhibition of 2-oxoglutarate dehydrogenase in potato tuber suggests the enzyme is limiting for respiration and confirms its importance in nitrogen assimilation. Plant Physiol. 148: 1782–1796 - PMC - PubMed
    1. Assmann S.M., Shimazaki Ki. (1999). The multisensory guard cell. Stomatal responses to blue light and abscisic acid. Plant Physiol. 119: 809–816 - PMC - PubMed

Publication types

MeSH terms

LinkOut - more resources