Comparative Study
. 2011 Mar 15;186(6):3441-51.
doi: 10.4049/jimmunol.1001271. Epub 2011 Feb 9.

Alterations in marginal zone macrophages and marginal zone B cells in old mice

Affiliations
Comparative Study

Alterations in marginal zone macrophages and marginal zone B cells in old mice

Shirin Z Birjandi et al. J Immunol. .

Abstract

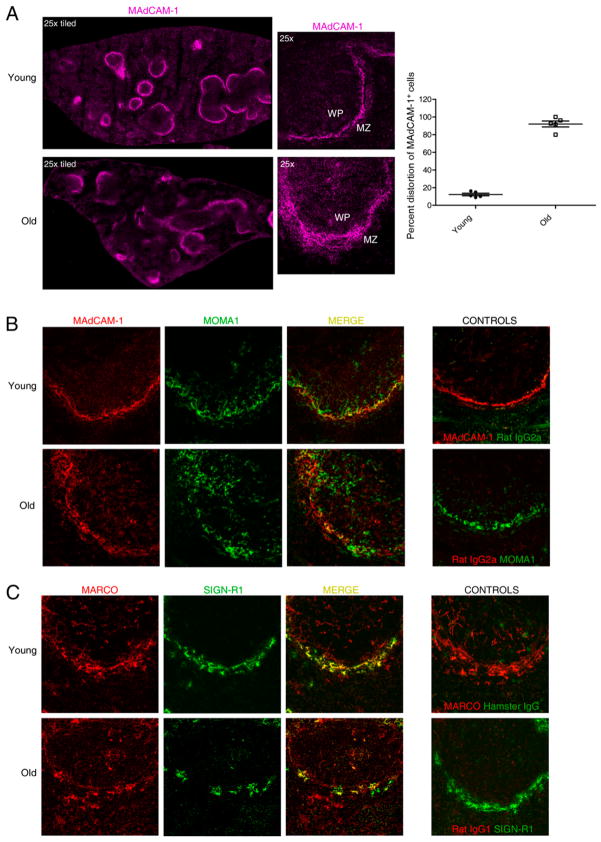
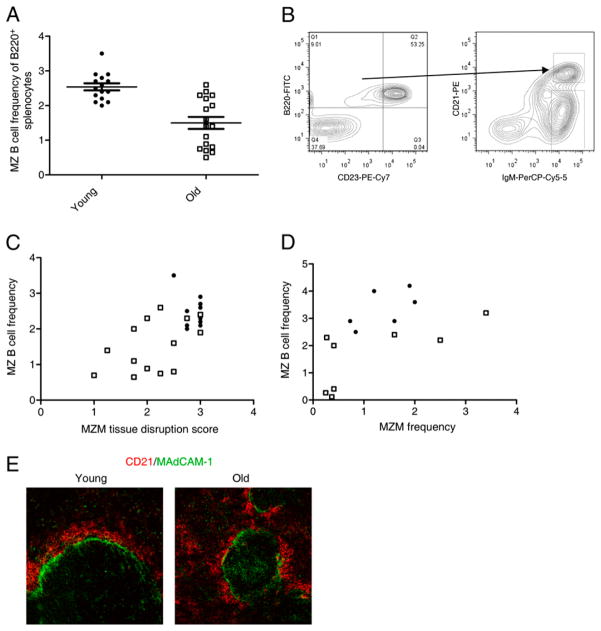
Marginal zones (MZs) are architecturally organized for clearance of and rapid response against blood-borne Ags entering the spleen. MZ macrophages (MZMs) and MZ B cells are particularly important in host defense against T-independent pathogens and may be crucial for the prevention of diseases, such as streptococcal pneumonia, that are devastating in older patients. Our objective was to determine whether there are changes in the cellular components of the MZ between old and young mice. Using immunocytochemistry and a blinded scoring system, we observed gross architectural changes in the MZs of old mice, including reduction in the abundance of MZMs surrounding the MZ sinus as well as disruptions in positioning of mucosal addressin cell adhesion molecule 1 (MAdCAM-1)(+) sinus lining cells and metallophilic macrophages. Loss of frequency of MZMs was corroborated by flow cytometry. A majority of old mice also showed reduced frequency of MZ B cells, which correlated with decreased abundance of MZM in individual old mice. The spleens of old mice showed less deposition of intravenously injected dextran particles within the MZ, likely because of the decreased frequency in MZMs, because SIGN-R1 expression was not reduced on MZM from old mice. The phagocytic ability of individual MZMs was examined using Staphylococcus aureus bioparticles, and no differences in phagocytosis were found between macrophages from young or old spleens. In summary, an anatomical breakdown of the MZ occurs in advanced age, and a reduction in frequency of MZM may affect the ability of the MZM compartment to clear blood-borne Ags and mount proper T-independent immune responses.


Conflict of interest statement

Disclosures

The authors have no financial conflicts of interest.

Figures

FIGURE 1
FIGURE 1
Morphologic comparison of the MZ architecture of young and old mice. A, Fixed, paraffin-embedded cross-sections of spleens stained with H&E demonstrating the range of disruption in the MZ of young and old mice. The top panels show white pulp areas (original magnifications ×25 and ×50) from one representative young mouse. At ×50 original magnification, the interface distortion (depicted by the inner line) is uniform, and the percent radius involvement (arrows point to minimal protrusion of cells inward) is ≤ 5%. The lower panels show white pulp areas (original magnifications ×25 and ×50) from one representative old mouse. At low- and high-power magnification, the interface distortion is severe and the percent radius involvement is ≥20% (arrows point at cells protruding into the white pulp area). B, Qualitative scoring of MZ histology as detailed in Materials and Methods. Each symbol indicates the summation of scores (0–8; most disrupted to least) for the two criteria assessed. Scores for four white pulp areas were averaged per animal. All slides were graded blind by two investigators. The horizontal bars indicate the average and SEM for each group. p = 0.0021 determined by Unpaired t test; n = 6 for each age group. Young mice (2–6 mo old, filled circles); old mice (18–23 mo, open squares).
FIGURE 2
FIGURE 2
Changes in the cellular compartments of the MZ region of young and old mice revealed by immunofluorescence. Representative images of frozen spleen sections (6–8 μm) stained for cells within various compartments of the MZ and analyzed by confocal microscopy. A, Left panels show staining for MAdCAM-1+ MZ sinus lining cells (purple) and low-power images (original magnification ×25, tiled images) of representative cross-sections of entire spleens. Middle panels show high-power (original magnification ×25) at the boundary of the white pulp (WP) and marginal zone (MZ). In spleens from young mice, MAdCAM-1+ MZ sinus lining cells formed a continuous, thin ring of cells; however in spleens from old mice, MAdCAM-1+ MZ sinus lining cells appeared as diffused or multilayered. The right panel shows that the extent of this diffused formation was quantified by measuring the relative linear portion affected in the line of MAdCAM-1+ cells in old (92.0 ± 3.3%) versus young (12.2 ± 1.4%) spleens, as detailed in Materials and Methods. Each symbol indicates an individual animal. The horizontal bars indicate the average and the SEM for each group. p = 0.0001 determined by unpaired t test; n = 5 for each age group. Filled circles indicate young mice (2–3 mo); open squares indicate old mice (18–23 mo. B, Sections were costained for MAdCAM-1+ MZ sinus lining cells (red, left panels; original magnification ×25) and MOMA+ macrophages (MMM; green, middle panels; original magnification ×25). High magnification showed that MMMs were tightly aligned with MAdCAM-1+ cells in young tissue. In contrast, MMMs appeared diffuse and infiltrated into the white pulp in old tissue. Far right panels show representative isotype controls. C, Staining for MZMs indicated by costaining for MARCO (red) and SIGN-R1 (green). MZM showed a continuous line encircling the white pulp in young animals in contrast to a patchy, discontinuous distribution in many spleens from old mice (original magnification ×25). Far right panels show isotype controls.
FIGURE 3
FIGURE 3
Semiquantitative assessment of MZM disruption in spleens from old mice. A, Immunocytochemistry of frozen sections (6–8 μm) stained to reveal MAdCAM-1+ MZ sinus lining cells (blue) and MARCO+ MZMs (brown). MZMs were semiquantified for the abundance of MARCO+ stain present and the continuity of MARCO+ MZM positioning around the MZ sinus (original magnification ×10 and ×25). Four separate white pulp areas were graded blind per animal and given a score from 1 to 3 (worst to best). Representatives from each grade are shown. Top panel represents a grade of 3, showing the typical abundant and continuous stain for MARCO+ MZMs surrounding the MZ sinuses. The middle panel corresponds to a grade of 2, showing moderate abundance of MARCO+ MZMs that moderately encircled the MZ sinus with patches. The lower panel corresponds to a score of 1, showing low or virtual absence of MARCO+ MZMs that, if present, were found in patches along the MZ sinus. B, Semiquantitative scoring of MZMs for the criteria above. Each symbol represents an average of the summation of the four scores for each animal. Horizontal bars indicate the average and SEM for each group. p = 0.0012 as determined Mann–Whitney U test; n = 13 young mice (2–3 mo, filled circles); n = 15 old mice (18–23 mo, open squares).
FIGURE 4
FIGURE 4
Quantitative assessment of the frequencies of MZMs in spleens from old versus young mice by flow cytometry. A, Identification of SIGN-R1+ cells (MZMs) in the CD11b low splenic fraction. Contours shown are representative of young spleen cells. B, Comparison of the frequencies of MZMs present in spleens from young and old mice. Each symbol represents an individual animal. Horizontal bars indicate the average and SEM for each age group. Old mice have on average an ~36% reduction in MZMs compared with young mice. p = 0.0163 determined by Mann–Whitney U test; n = 14 young mice (2–3 mo, filled circles); n = 15 old mice (18–23 mo, open squares). C, Comparison of the MFIs of SIGN-R1 of MZMs from young and old mice (p = 0.0088). D, Comparison of the forward scatter (relative cell size) of MZMs from young and old mice (p = 0.0006). Data presented in C and D are represented using the ratio of sample value over the average value of all young obtained within each experimental group. Data are expressed as mean ± SEM and are representative of four separate experiments. n = 10 young mice (2–3 mo); n = 10 old mice (19–23 mo).
FIGURE 5
FIGURE 5
Comparison of the ability of MZs of old versus young mice to clear blood-borne dextran particles. Confocal images of frozen splenic sections harvested 45 min after dextran-FITC (green) was given i.v. As reported by Ato et al. (31) for young mice, dextran binds to MZMs, appearing as a continuous ring on the outer edge of the MZ sinus. A, Colocalization of dextran on MARCO+ MZM (red) is observed in yellow after staining dextran positive tissue from a representative young mouse and old mouse with young-like display of MZM. B, Typical deposition, represented by two of six young (top panels) and two of six old (bottom panels) mice. In the spleens of most old mice, uptake of dextran appeared in discontinuous patches along the outer edge of the MZ sinus. MAdCAM-1+ MZ sinus lining cells (purple) are stained as a landmark. Young (2–3 mo) and old (18–23 mo) female BALB/c mice. C, Spleens from control, PBS-injected mice showing absence of green deposition around the MAdCAM-1+ MZ sinus. Flow cytometry was used to confirm the frequency of MZMs for each spleen (four of six old spleens had MZM frequency less than all the young spleens).
FIGURE 6
FIGURE 6
Comparison of the ability of MZMs from old and young mice to phagocytose pHrodo S. aureus bio-particles. Young and old mice were administered dextran-FITC (green) i.v. to mark the MZMs in vivo. Forty-five minutes later, spleens were harvested and the cells allowed to adhere for 1 h. The adherent cells were cultured with pHrodo bioparticles for an additional hour to assess phagocytic activity. A, Confocal images of live adherent dextran+pHrodo+ MZMs (original magnification ×5000) at a cell thickness of 1 μm. Photographs are representative of MZMs identified among young (top panels) or old (bottom panels) adherent cells. Left panels, dextran (green); middle panels, pHrodo+ bioparticles (red) within phagocytic compartments; right panels, overlay. The upper right panel shows an example of a dextran+ pHrodo+ MZM next to a macrophage without dextran. B, Comparison the MFIs of pHrodo+ phagocytized by MZMs from young and old mice. p = 0.2689, Mann–Whitney U test. C, Comparison of the number of pHrodo+ phagocytic compartments in representative images of MZMs from young and old mice. p = 0.5989, unpaired t test. D, Comparison of the MFIs of dextran-FITC was determined; p = 0.4256, Mann–Whitney U test. E, Comparison of the relative size (arbitrary units) of adherent MZMs from young and old mice. p = 0.1317, unpaired t test. Data in B and D are presented as a ratio of the sample MFI over the average MFI of young per experimental group. n = 10 young mice (2–3 mo); n = 9 old mice (19–23 mo) for data in B, D, and E. n = 8 young mice (2–3 mo); n = 7 old mice (19–23 mo) for data in C. The data are expressed as mean ± SEM of six separate experiments.
FIGURE 7
FIGURE 7
Comparison of frequencies of MZ B cells in young and old mice and correlation with abundance of MZM. A, Frequency of MZ B cells within the B220+ population. Symbols represent individual mice, and the horizontal bars indicate the average and SEM for each age group. On average, old mice have ~40% decrease in the frequency of MZ B cells compared with young mice. p = 0.0002, determined by Mann–Whitney U test (n = 15 young and 17 old mice). B, The MZ B cell population was determined by gating on the B220+/CD23 fraction followed by gating on the CD21/35high/IgMhigh fraction. C, Pearson correlation analysis was performed on 25 spleens from both age groups shown in A that were also sectioned, stained with anti-MARCO, and scored for MZM criteria. r = 0.6429; p = 0.0003. D, Pearson correlation analysis was performed in a separate experiment to compare the frequency of MZ B cells versus the frequency of MZMs assessed by flow cytometry; r = 0.5857; p = 0.0278 on 14 additional spleens (not shown in panel A) from both age groups. Symbols in A, C, and D represent young mice (2–3 mo, filled circles) or old mice (18–23 mo, open squares). E, Representative distribution of MZ B cells 5 min after in vivo injection with anti-CD21/PE Abs (30). Left panel, Young female BALB/c mice (2–3 mo); right panel, old female BALB/c mice (18–23 mo).

References

    1. Artz AS, Ershler WB, Longo DL. Pneumococcal vaccination and revaccination of older adults. Clin Microbiol Rev. 2003;16:308–318. - PMC - PubMed
    1. van der Poll T, Opal SM. Pathogenesis, treatment, and prevention of pneumococcal pneumonia. Lancet. 2009;374:1543–1556. - PubMed
    1. Bondada S, Wu H, Robertson DA, Chelvarajan RL. Accessory cell defect in unresponsiveness of neonates and aged to polysaccharide vaccines. Vaccine. 2000;19:557–565. - PubMed
    1. Butler JC, Shapiro ED, Carlone GM. Pneumococcal vaccines: history, current status, and future directions. Am J Med. 1999;107(1A):69S–76S. - PubMed
    1. Kirby AC, Beattie L, Maroof A, van Rooijen N, Kaye PM. SIGNR1-negative red pulp macrophages protect against acute streptococcal sepsis after Leishmania donovani-induced loss of marginal zone macrophages. Am J Pathol. 2009;175:1107–1115. - PMC - PubMed

Publication types

MeSH terms