

Improved stimulus representation by short interspike intervals in primary auditory cortex
- PMID: 21307320
- PMCID: PMC3075280
- DOI: 10.1152/jn.01055.2010
Improved stimulus representation by short interspike intervals in primary auditory cortex
Abstract
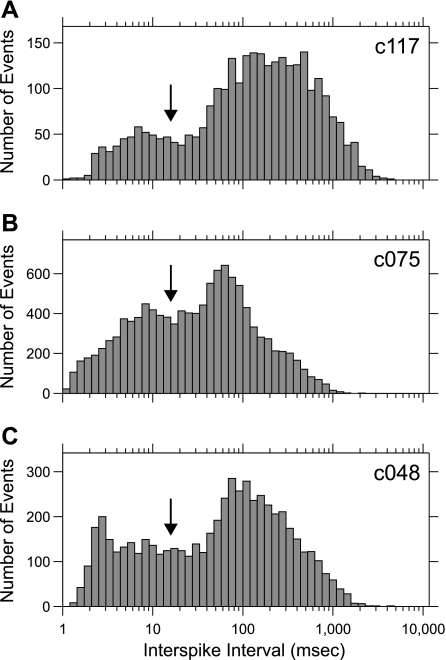
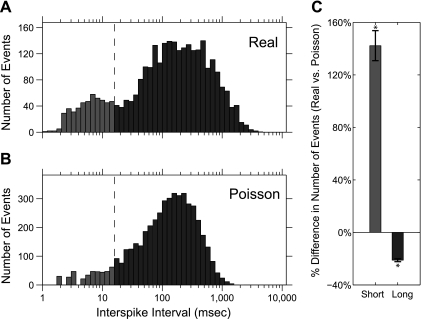
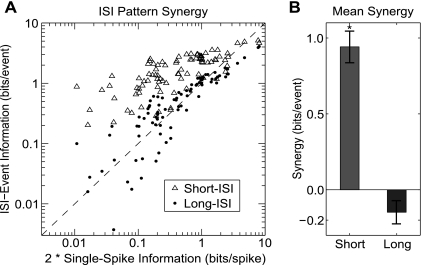
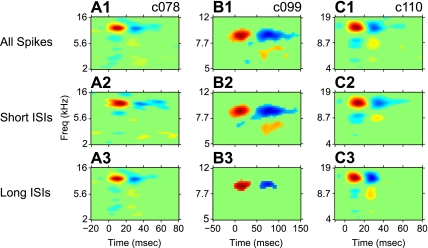
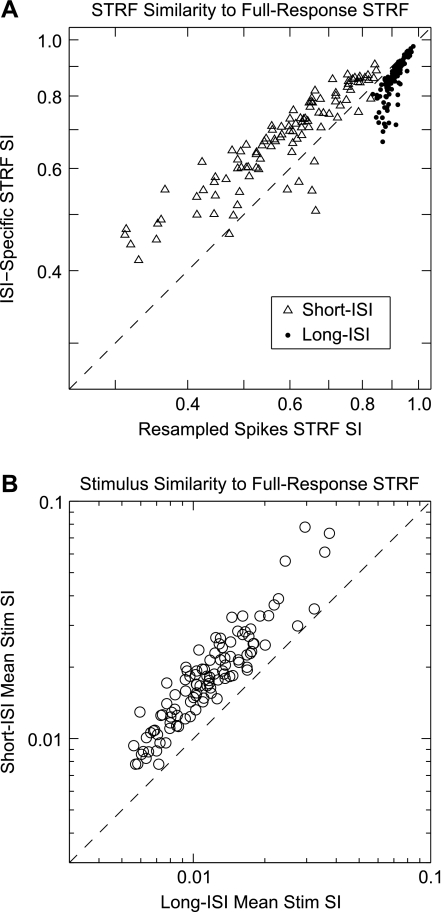
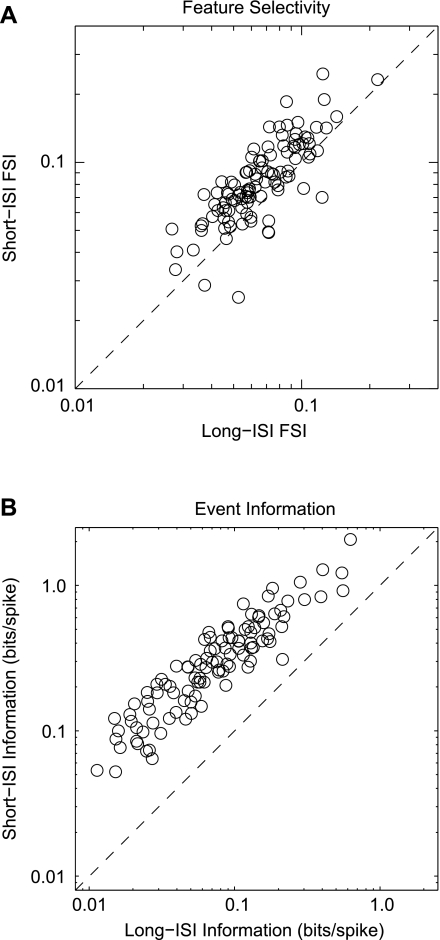
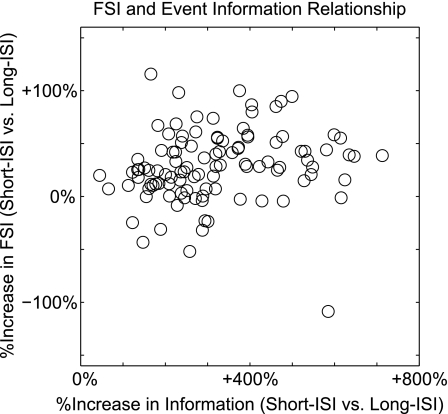
We analyzed the receptive field information conveyed by interspike intervals (ISIs) in the auditory cortex. In the visual system, different ISIs may both code for different visual features and convey differing amounts of stimulus information. To determine their potential role in auditory signal processing, we obtained extracellular recordings in the primary auditory cortex (AI) of the cat while presenting a dynamic moving ripple stimulus and then used the responses to construct spectrotemporal receptive fields (STRFs). For each neuron, we constructed three STRFs, one for short-ISI events (ISI < 15 ms); one for isolated, long-ISI events (ISI > 15 ms); and one including all events. To characterize stimulus encoding, we calculated the feature selectivity and event information for each of the STRFs. Short-ISI spikes were more feature selective and conveyed information more efficiently. The different ISI regimens of AI neurons did not represent different stimulus features, but short-ISI spike events did contribute over-proportionately to the full spike train STRF information. Thus short-ISIs constitute a robust representation of auditory features, and they are particularly effective at driving postsynaptic activity. This suggests that short-ISI events are especially suited to provide noise immunity and high-fidelity information transmission in AI.
Figures
Similar articles
-
Stimulus-induced spike bursts in two fields of cat auditory cortex.Hear Res. 1996 Aug;97(1-2):165-73. Hear Res. 1996. PMID: 8844196
-
Plasticity of Multidimensional Receptive Fields in Core Rat Auditory Cortex Directed by Sound Statistics.Neuroscience. 2021 Jul 15;467:150-170. doi: 10.1016/j.neuroscience.2021.04.028. Epub 2021 May 2. Neuroscience. 2021. PMID: 33951506 Free PMC article.
-
Functional congruity in local auditory cortical microcircuits.Neuroscience. 2016 Mar 1;316:402-19. doi: 10.1016/j.neuroscience.2015.12.057. Epub 2016 Jan 5. Neuroscience. 2016. PMID: 26768399 Free PMC article.
-
Context dependence of spectro-temporal receptive fields with implications for neural coding.Hear Res. 2011 Jan;271(1-2):123-32. doi: 10.1016/j.heares.2010.01.014. Epub 2010 Feb 1. Hear Res. 2011. PMID: 20123121 Review.
-
Does attention play a role in dynamic receptive field adaptation to changing acoustic salience in A1?Hear Res. 2007 Jul;229(1-2):186-203. doi: 10.1016/j.heares.2007.01.009. Epub 2007 Jan 16. Hear Res. 2007. PMID: 17329048 Free PMC article. Review.
Cited by
-
Distinct Manifestations of Cooperative, Multidimensional Stimulus Representations in Different Auditory Forebrain Stations.Cereb Cortex. 2020 May 14;30(5):3130-3147. doi: 10.1093/cercor/bhz299. Cereb Cortex. 2020. PMID: 32047882 Free PMC article.
-
Differences between spectro-temporal receptive fields derived from artificial and natural stimuli in the auditory cortex.PLoS One. 2012;7(11):e50539. doi: 10.1371/journal.pone.0050539. Epub 2012 Nov 27. PLoS One. 2012. PMID: 23209771 Free PMC article.
-
Coordinated neuronal ensembles in primary auditory cortical columns.Elife. 2018 Jun 5;7:e35587. doi: 10.7554/eLife.35587. Elife. 2018. PMID: 29869986 Free PMC article.
-
Hierarchical representations in the auditory cortex.Curr Opin Neurobiol. 2011 Oct;21(5):761-7. doi: 10.1016/j.conb.2011.05.027. Epub 2011 Jun 23. Curr Opin Neurobiol. 2011. PMID: 21704508 Free PMC article. Review.
-
Attention-dependent reductions in burstiness and action-potential height in macaque area V4.Nat Neurosci. 2013 Aug;16(8):1125-31. doi: 10.1038/nn.3463. Epub 2013 Jul 14. Nat Neurosci. 2013. PMID: 23852114 Free PMC article.
References
-
- Aertsen AM, Olders JH, Johannesma PI. Spectro-temporal receptive fields of auditory neurons in the grassfrog. III. Analysis of the stimulus-event relation for natural stimuli. Biol Cybern 39: 195–209, 1981 - PubMed
-
- Aguera y Arcas B, Fairhall AL, Bialek W. Computation in a single neuron: Hodgkin and Huxley revisited. Neural Comput 15: 1715–1749, 2003 - PubMed
-
- Brenner N, Strong SP, Koberle R, Bialek W, de Ruyter van Steveninck RR. Synergy in a neural code. Neural Comput 12: 1531–1552, 2000 - PubMed
-
- Britvina T, Eggermont JJ. A Markov model for interspike interval distributions of auditory cortical neurons that do not show periodic firings. Biol Cybern 96: 245–264, 2007 - PubMed
Publication types
MeSH terms
Grants and funding
LinkOut - more resources
Full Text Sources
Miscellaneous