. 2011 Apr;105(4):1798-814.
doi: 10.1152/jn.00910.2010. Epub 2011 Feb 9.

Information transmission and detection thresholds in the vestibular nuclei: single neurons vs. population encoding

Affiliations

Information transmission and detection thresholds in the vestibular nuclei: single neurons vs. population encoding

Corentin Massot et al. J Neurophysiol. 2011 Apr.

Abstract

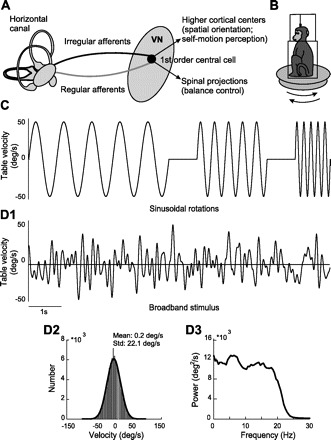
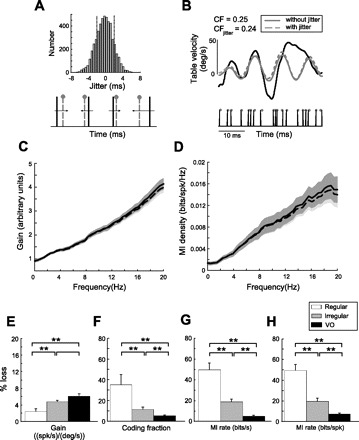
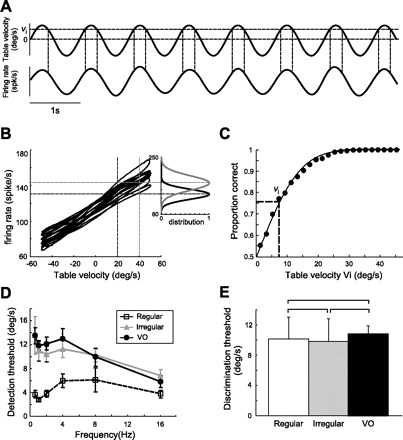
Understanding how sensory neurons transmit information about relevant stimuli remains a major goal in neuroscience. Of particular relevance are the roles of neural variability and spike timing in neural coding. Peripheral vestibular afferents display differential variability that is correlated with the importance of spike timing; regular afferents display little variability and use a timing code to transmit information about sensory input. Irregular afferents, conversely, display greater variability and instead use a rate code. We studied how central neurons within the vestibular nuclei integrate information from both afferent classes by recording from a group of neurons termed vestibular only (VO) that are known to make contributions to vestibulospinal reflexes and project to higher-order centers. We found that, although individual central neurons had sensitivities that were greater than or equal to those of individual afferents, they transmitted less information. In addition, their velocity detection thresholds were significantly greater than those of individual afferents. This is because VO neurons display greater variability, which is detrimental to information transmission and signal detection. Combining activities from multiple VO neurons increased information transmission. However, the information rates were still much lower than those of equivalent afferent populations. Furthermore, combining responses from multiple VO neurons led to lower velocity detection threshold values approaching those measured from behavior (∼ 2.5 vs. 0.5-1°/s). Our results suggest that the detailed time course of vestibular stimuli encoded by afferents is not transmitted by VO neurons. Instead, they suggest that higher vestibular pathways must integrate information from central vestibular neuron populations to give rise to behaviorally observed detection thresholds.


Figures

Fig. 1.
Fig. 1.
Experimental setup and stimuli used. A: general description of the vestibular system. Vestibular information is transmitted from the sensory end-organs through 2 types of afferents (regular and irregular) and converges on 1st order central cells in the vestibular nuclei (VN), which then project to other centers. B: during the experiment, the monkey was comfortably seated in a chair placed on a turntable. C: examples of horizontal sinusoidal stimuli for different frequencies (1, 2, and 4 Hz reaching 50°/s peak velocity). D1: an example time series of the broadband (0–20 Hz) noise stimulus used to further characterize neuronal responses. D2: velocities were distributed normally with 0 mean and 20°/s SD (Std.). D3: the power spectrum of the noise stimulus had relative constant power for frequencies up to 20 Hz.
Fig. 2.
Fig. 2.
The coefficient of variation (CV) decreases as a function of the resting discharge rate for vestibular only (VO) neurons. A: CV as a function of the resting discharge rate. Both VO neurons and irregular afferents showed a negative correlation of their CV with the resting firing rate. B: the normalized coefficient of variation (CV*) does not show any significant correlation with resting discharge rate.
Fig. 3.
Fig. 3.
Spontaneous activity of a typical VO neuron compared with that of vestibular afferents. A: interspike interval (ISI) histogram from a typical VO neuron (CV*VO = 0.43). B and C: ISI histograms from typical regular and irregular afferents, respectively (CV*reg = 0.04 and CV*irreg = 0.3). D: spike train power spectra for the same example VO neuron and afferents. E: resting discharge rates for VO neurons and afferents. F: box plots of the CV* of the population of VO neurons and afferents. VO neurons were significantly more irregular than either group of afferents. **Statistical significance using a t-test at the P < 0.01 level. spk, Spikes.
Fig. 4.
Fig. 4.
Population-averaged gains and phases as a function of frequency for VO neurons in response to sinusoidal stimulation. A: comparison of population-averaged gains of VO neurons and afferents obtained during sinusoidal horizontal rotations. Note that VO neuronal gains increased as a function of frequency in a manner that mirrored the frequency dependence of irregular afferents. As a result, the gains of both groups of cells were comparable at 16 Hz. B: population-averaged phases of VO neurons and afferents to sinusoidal horizontal rotations. The error bars show 1 SE. ** And * indicate statistically significant differences between cell groups at 16 Hz using a t-test at the P = 0.01 and 0.05 levels, respectively.
Fig. 5.
Fig. 5.
VO neurons display poor stimulus reconstruction. A: table velocity (gray) and reconstructed table velocity (dashed black) for a typical VO neuron. The spike train and the time-dependent firing rate in response to this stimulus are also shown at the bottom. This example neuron displayed a poor coding fraction (CF) of 0.25 indicating that, on average, only 25% of the stimulus could be reconstructed. The inset shows the optimal filter waveform that was convolved with the spike train to maximally reconstruct the table velocity. B: CF of VO neurons and afferents as a function of CV*. We found a significant negative correlation (r = −0.67, P < 10−4; n = 43), which implies that increasing resting discharge variability is detrimental to stimulus reconstruction. The inset shows the population-averaged CF of the VO neurons and the afferents. The vertical bars shows 1 SE. Comparison with average afferent responses revealed that VO neurons displayed lower CF than both regular (Reg) and irregular (Irreg) afferents (**statistical significance at the P < 0.01 level using a Wilcoxon rank sum test). C: CF of VO neurons and afferents plotted as a function of mean resting discharge. We found a significant positive correlation (r = 0.57, P < 10−4; n = 43) indicating that higher resting discharge is beneficial to stimulus reconstruction.
Fig. 6.
Fig. 6.
VO neurons display lower information rates than afferents. A: population-averaged gains (dashed) as well as lower (blue) and upper (red) mutual information (MI) density curves as a function of frequency for VO neurons. The gray bands show 1 SE. Note that, since the upper bound is by definition always higher than or equal to the lower bound for each individual neuron, the fact that the population-averaged curves were close to one another implies that they must also be close for most individual VO neurons. B: population-averaged lower-bound estimates of the MI rate (bits per second) for VO neurons and afferents. C: population-averaged lower-bound estimates of the MI rate normalized by the mean firing rate (bits per spike) for VO neurons and afferents. This normalization accounts for the dependence of MI on the firing rate (see text for explanation). D: population-averaged upper-bound estimates of the MI rate (bits per second) for VO neurons and afferents. E: population-averaged upper-bound estimates of the MI rate normalized by the mean firing rate (bits per spike) for VO neurons and afferents. ** And * indicate statistical significance using a t-test at the P = 0.01 and 0.05 levels, respectively.
Fig. 7.
Fig. 7.
Effects of spike-timing jitter on the gain and MI density of VO neurons. A: a random number drawn from a normal distribution centered at 0 ms with a SD of 2 ms was added to the time of each spike. B: example reconstruction of the velocity input (gray) from the original spike train before (black) and after (red) addition of 2-ms jitter. Addition of jitter had minimal effect on the CF. C and D: gain and MI curves with (dashed) and without (solid) addition of 2-ms jitter. Light and dark gray bands indicate 1 SE for the curves with and without jitter, respectively. E: population-averaged gain loss (percentage) of VO neurons and afferents after the addition of jitter was negligible in all cases. F–H: population-averaged percentage loss of CF, MI (bits per second), and MI per spike (bits per spike) values of VO neurons and afferents resulting from the addition of jitter, respectively. For all 3 measures, VO neurons showed significantly less percentage loss than both regular and irregular afferents. **Statistical significance at the P = 0.01 level using a t-test.
Fig. 8.
Fig. 8.
Individual VO neurons display velocity detection thresholds that are greater than or equal to those of afferents. A: table velocity (upper) and time-dependent firing rate (lower) during sinusoidal stimulation. A comparison was made between the distribution of the instantaneous firing rate when the table velocity is equal to a given value (Vi) and that obtained when the table velocity is equal to 0. B: plot of the instantaneous firing rate as a function of table velocity for an example VO neuron. Also shown are schematic representations of the instantaneous firing rate distributions for Vi = 20 and 40°/s. C: neurometric function obtained using receiver operating characteristic (ROC) analysis of the firing-rate distributions for different values of Vi. The detection threshold corresponds to 76% probability of correct detection (dashed lines). D: population-averaged detection threshold values for VO neurons and afferents as a function of the sinusoidal stimulus frequency. Error bars indicate 1 SE. E: velocity thresholds of VO neurons and afferents for discriminating between 8- and 16-Hz sinusoidal head rotations.
Fig. 9.
Fig. 9.
Combining the activities of multiple VO neurons causes significant increases in MI rate and thus better stimulus estimation. A: population-averaged MI density curves as a function of frequency for broadband stimuli increase as a function of the population size (n). The gray line shows the MI rate for a single neuron (i.e., n = 1) for comparison. B: population-averaged MI density curves as a function of population size. Individual curves show this relationship for different frequencies between 4 and 20 Hz. C and D: MI rate and CF for VO neurons and afferents as a function of n, respectively. E and F: percentage increase of the MI rate and CF for VO neurons and afferents as a function of n, respectively.
Fig. 10.
Fig. 10.
Combining the activities of multiple VO neurons causes a significant decrease in the velocity detection threshold. A: population-averaged detection threshold values for VO neurons decrease as a function of the population size. Error bars indicate 1 SE. The gray line shows the velocity detection threshold for n = 1 for comparison. B: thresholds normalized relative to the values at n = 1 as a function of frequency. A similar amount of decrease can be observed over all the frequencies for each population size. C: population-averaged detection threshold values for VO neurons and afferents for 1-Hz sinusoidal stimulation as a function of the population size n. The last 4 data points were used to compute the rate at which the detection threshold decreases as a function of n (black and gray lines). D: rate of decrease of the velocity detection threshold for VO neurons and afferents. *Statistical significance at the P = 0.05 level using a t-test.

References

    1. Abbott LF, Dayan P. The effect of correlated variability on the accuracy of a population code. Neural Comput 11: 91–101, 1999 - PubMed
    1. Ahissar E, Sosnik R, Haidarliu S. Transformation from temporal to rate coding in a somatosensory thalamocortical pathway. Nature 406: 302–306, 2000 - PubMed
    1. Angelaki DE, Cullen KE. Vestibular system: the many facets of a multimodal sense. Annu Rev Neurosci 31: 125–150, 2008 - PubMed
    1. Averbeck BB, Lee D. Effects of noise correlations on information encoding and decoding. J Neurophysiol 95: 3633–3644, 2006 - PubMed
    1. Baird RA, Desmadryl G, Fernandez C, Goldberg JM. The vestibular nerve of the chinchilla. II. Relation between afferent response properties and peripheral innervation patterns in the semicircular canals. J Neurophysiol 60: 182–203, 1988 - PubMed

Publication types

LinkOut - more resources