. 2011 Apr 15;22(8):1330-9.
doi: 10.1091/mbc.E10-11-0891. Epub 2011 Feb 9.

Dynamic and structural signatures of lamellar actomyosin force generation

Affiliations

Dynamic and structural signatures of lamellar actomyosin force generation

Yvonne Aratyn-Schaus et al. Mol Biol Cell. .

Abstract

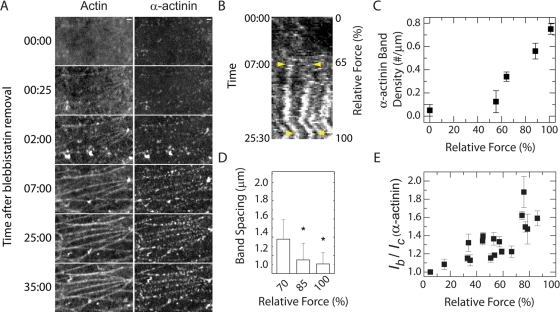
The regulation of cellular traction forces on the extracellular matrix is critical to cell adhesion, migration, proliferation, and differentiation. Diverse lamellar actin organizations ranging from contractile lamellar networks to stress fibers are observed in adherent cells. Although lamellar organization is thought to reflect the extent of cellular force generation, understanding of the physical behaviors of the lamellar actin cytoskeleton is lacking. To elucidate these properties, we visualized the actomyosin dynamics and organization in U2OS cells over a broad range of forces. At low forces, contractile lamellar networks predominate and force generation is strongly correlated to actomyosin retrograde flow dynamics with nominal change in organization. Lamellar networks build ∼60% of cellular tension over rapid time scales. At high forces, reorganization of the lamellar network into stress fibers results in moderate changes in cellular tension over slower time scales. As stress fibers build and tension increases, myosin band spacing decreases and α-actinin bands form. On soft matrices, force generation by lamellar networks is unaffected, whereas tension-dependent stress fiber assembly is abrogated. These data elucidate the dynamic and structural signatures of the actomyosin cytoskeleton at different levels of tension and set a foundation for quantitative models of cell and tissue mechanics.


Figures

FIGURE 1:
FIGURE 1:
Transitions between lamellar networks and stress fibers occurs near the periphery of spread cells. (A) Images of mApple-actin and GFP-MLC (myosin light chain), used to visualize myosin II, in a U2OS cell. Scale bar, 5 μm. (B) Average center-to-center band spacing for myosin (n = 24 band pairs within three cells) and α-actinin (n = 16 band pairs within two cells) along actin bundles. Error bars indicate SE. (C) Left, image is the region of interest indicated by box in (A), with a dashed yellow line indicating bundle used to generate kymograph. Right, a kymograph generated from images along the line scan in the image on the left and stacked over time. The yellow arrows indicate locations of two neighboring myosin bands during stress fiber formation. (D) Top, time-lapse images of GFP-MLC; bottom, underlying traction stress during cell protrusion. Traction stress vectors are overlaid as white arrows on top of heat scale images, which indicate the stress magnitudes. Vector scale bar, 400 Pa; distance scale bar, 5 μm. Time indicated in min:s.
FIGURE 2:
FIGURE 2:
Dynamic coordination of F-actin remodeling with changes in traction force. (A) Top, GFP-actin images before (control) and after treatment and removal of blebbistatin. Scale bar, 10 μm. Middle, pseudocolor images of the order parameter calculated from GFP-actin images shown above, with red representing the highest order and blue representing the lowest order. Bottom, images of mApple-paxillin for the region of interest indicated by white box in GFP-actin images with traction stress vectors (red arrows) overlaid. Vector scale bar, 150 Pa. Time indicated in min:s. (B) The mean linear density of actin bundles vs. time after blebbistatin removal. Dashed line indicates a fit of the data with a single exponential, with a time scale, t1, of 8 ± 3 min. Error bars indicate SE, with a sample size of 31 bundles within three cells. (C) The ratio of the peak GFP-actin intensity within bundles, Ib, to the GFP-actin intensity of the surrounding cytoplasm, Ic, as a function of time after blebbistatin removal, with each data point representing 9–12 bundles within three cells. (D) Order parameter as a function of time prior to and after blebbistatin removal. Dashed line indicates fit of data to a single exponential with a time scale of 10 ± 6 min. Data reflect mean and SE from n = 4 cells. (E) Total cellular traction force prior to and after blebbistatin removal. The relative force, calculated as a percentage, that is used in subsequent figures is shown on the right-hand axis. Dashed line indicates a fit to a double exponential with a fast time scale of t1 = 0.5 ± 0.5 min and a slower time of t2 = 10 ± 3 min. Data reflect mean and SE from n = 10 cells.
FIGURE 3:
FIGURE 3:
Rapid force generation is inversely correlated to lamellar retrograde flow speed. (A) Images of (left) GFP-MLC and (right) mApple-actin before (Control) and after removal of blebbistatin. Insets show color combine images at 3:00 and 20:00, which reveal colocalization of MLC (green) and F-actin (red) for regions outlined by white boxes in the bottom panel. Scale bar, 10 μm. Time indicated in min:s. (B) Images of GFP-MLC from region of interest indicated by white rectangle in the MLC image at 0:00 overlaid with corresponding flow vectors (yellow) obtained at 25 s and 2 min after blebbistatin removal. Vector scale, 30 nm/s. (C) Average myosin flow speed vs. time after blebbistatin removal. Data reflect mean and SE from ∼500 flow vectors. Inset, maximum myosin speed over the same times. (D) Relative force vs. average myosin flow speed with different symbols indicating data obtained for three representative cells. Each data point reflects the mean of more than one hundred flow measurements. A strong inverse relationship is observed between 0 and 60% force (Pearson r = −0.79), and the dashed line indicates the best linear fit to these data.
FIGURE 4:
FIGURE 4:
Remodeling of myosin bands during bundle formation. (A) Images of GFP-MLC after blebbistatin removal showing typical process of stress fiber formation. Scale bar, 1 μm. Times indicate min:s. Dashed lines indicate locations of terminal ends of the same bundle over time. (B) Images of GFP-MLC with overlaid flow vectors across several time points during stress fiber formation. Red vectors indicate bands within a bundle of interest; yellow vectors indicate bands within surrounding bundles. Scale bar, 1 μm; flow vector scale bar, 2.5 nm/s. Times indicated in min:s. (C) Kymograph of a line scan of GFP-MLC along a bundle as a stress fiber is formed after blebbistatin removal, with high-intensity streaks revealing the location of myosin bands. Relative force indicated on right-hand axis. Yellow arrows indicate locations on neighboring myosin bands at early times (low force) and late times (high force). (D) Average myosin band spacing along bundles vs. relative cellular traction force. Data reflect mean and SD for n = 10–47 pairs of myosin bands within three cells. The * indicates p-values < 0.05 between data and data obtained at 0%, as calculated by Student’s t test.
FIGURE 5:
FIGURE 5:
α-Actinin bands form and intensify during stress fiber formation. (A) Images of mApple-actin and GFP-α-actinin over time after blebbistatin removal. Time indicated in min:s. Scale bar, 1 μm. (B) Kymograph of a line scan along an actin bundle over time after blebbistatin removal. High-intensity streaks indicate the location of α-actinin bands along the bundle. The yellow arrows indicate the location of two neighboring bands at the average time of appearance along the bundle (7:00) and at later times. Relative force is indicated on the right-hand axis. (C) Average linear density of α-actinin bands in bundles as a function of force. Error bars indicate SE from a sample size of 35 bundles within three cells. (D) Bar chart of α-actinin band spacing as a function of force. The absence of bands precludes measurements at lower forces. Error bars indicated SD about the mean for a sample size, n = 7, 8, and 24 α-actinin band pairs for 70%, 85%, and 100% force recovered, respectively. The * indicates p-values < 0.05 between the data and data obtained at 70% force recovery, as determined by Student’s t test. (E) Peak intensity of GFP-α-actinin band, Ib, relative to the surrounding cytoplasm, Ic, as a function of relative force. Data reflect mean and SE from 24–60 bands in three cells.
FIGURE 6:
FIGURE 6:
Dynamic coordination of F-actin remodeling with changes in traction force on soft matrices. (A) Images of (top) GFP-actin and (middle) mApple-paxillin before (Control) and after treatment and removal of blebbistatin for U2OS cells plated on a PAA gel with stiffness of 0.6 kPa. Heat maps of traction stresses (bottom) underlying focal adhesions, with stress magnitude scale on the right. Time indicated in min:s. Scale bar, 5 μm. (B) Total cellular traction force prior to and after blebbistatin removal for stiff (2.8 kPa) and soft (0.6 kPa) gels. Dashed line indicates a fit to a double exponential for force recovery on stiff gels and red line indicates a fit to a single exponential for force recovery on soft gels, showing nearly identical recovery at fast time scales. Error bars indicate the SE with a sample size of n = 10 cells for 2.8 kPa gel and n = 4 cells for 0.6 kPa gel. (C) Relative force vs. average myosin flow speed on soft (0.6 kPa) gels.
FIGURE 7:
FIGURE 7:
Correlation between cellular tension states and changes in cytoskeletal organization and dynamics. At low tension and rapid time scales, increased cellular force generation is inversely correlated to retrograde flow dynamics in a contractile actin network. At higher tension and slower time scales, retrograde flow stabilizes and F-actin bundles form and thicken. During bundle thickening, both actin and α-actinin bands intensify and the band spacing decreases from ∼2 to ∼1 μm. At the highest tension, stress fibers composed of α-actinin and myosin bands with a spacing of ∼1 μm are formed.

References

    1. Alexandrova AY, Arnold K, Schaub S, Vasiliev JM, Meister JJ, Bershadsky AD, Verkhovsky AB. Comparative dynamics of retrograde actin flow and focal adhesions: formation of nascent adhesions triggers transition from fast to slow flow. PLoS ONE. 2008;3:e3234. - PMC - PubMed
    1. Aratyn-Schaus Y, Gardel ML. Transient frictional slip between integrin and the ECM in focal adhesions under myosin II tension. Curr Biol. 2010;20:1145–1153. - PMC - PubMed
    1. Balaban NQ, et al. Force and focal adhesion assembly: a close relationship studied using elastic micropatterned substrates. Nat Cell Biol. 2001;3:466–472. - PubMed
    1. Bartles JR. Parallel actin bundles and their multiple actin-bundling proteins. Curr Opin Cell Biol. 2000;12:72–78. - PMC - PubMed
    1. Beningo KA, Hamao K, Dembo M, Wang YL, Hosoya H. Traction forces of fibroblasts are regulated by the Rho-dependent kinase but not by the myosin light chain kinase. Arch Biochem Biophys. 2006;456:224–231. - PMC - PubMed

Publication types