. 2011 Feb 10;470(7333):221-6.
doi: 10.1038/nature09736.

Functional identification of an aggression locus in the mouse hypothalamus

Affiliations

Functional identification of an aggression locus in the mouse hypothalamus

Dayu Lin et al. Nature. .

Abstract

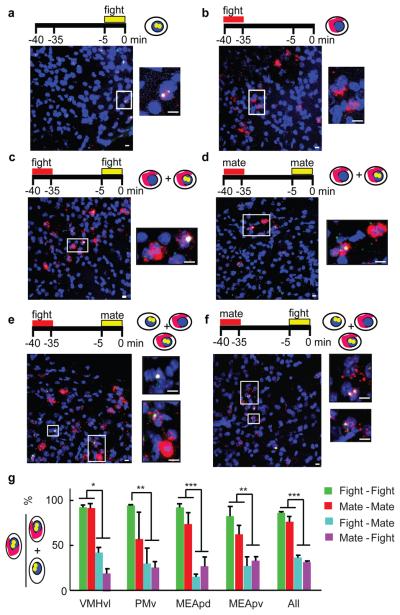
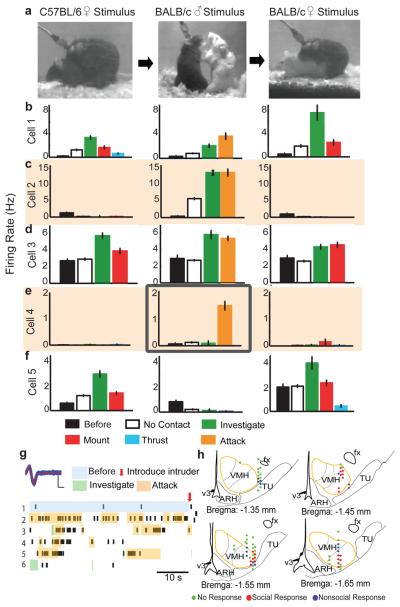
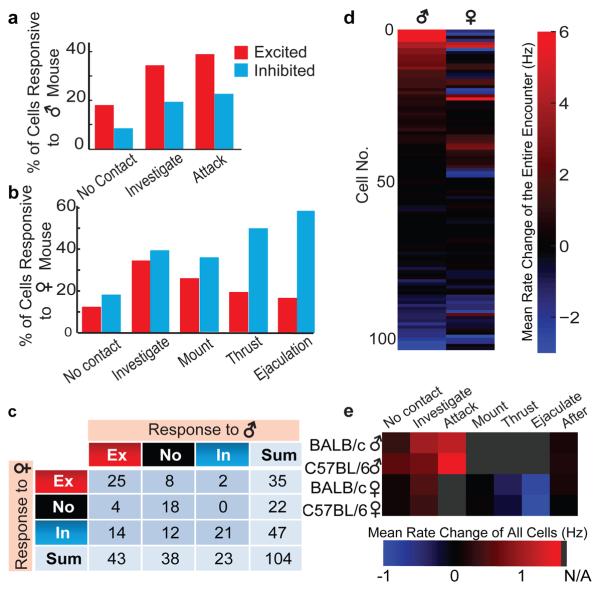
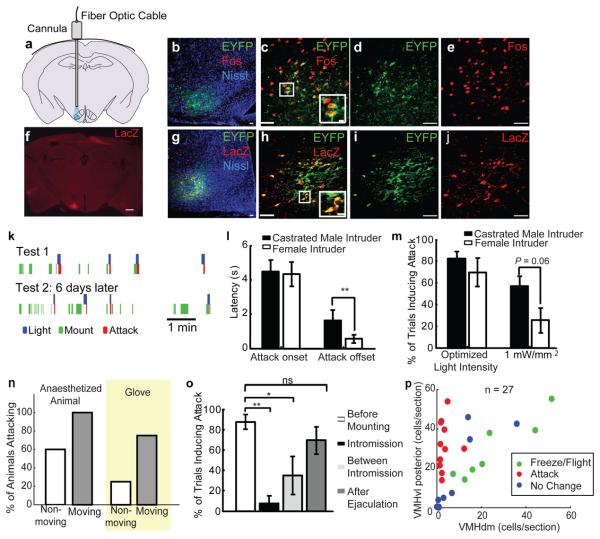
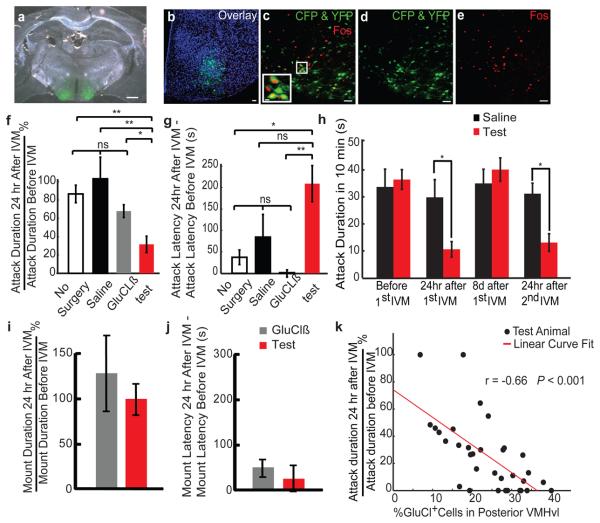
Electrical stimulation of certain hypothalamic regions in cats and rodents can elicit attack behaviour, but the exact location of relevant cells within these regions, their requirement for naturally occurring aggression and their relationship to mating circuits have not been clear. Genetic methods for neural circuit manipulation in mice provide a potentially powerful approach to this problem, but brain-stimulation-evoked aggression has never been demonstrated in this species. Here we show that optogenetic, but not electrical, stimulation of neurons in the ventromedial hypothalamus, ventrolateral subdivision (VMHvl) causes male mice to attack both females and inanimate objects, as well as males. Pharmacogenetic silencing of VMHvl reversibly inhibits inter-male aggression. Immediate early gene analysis and single unit recordings from VMHvl during social interactions reveal overlapping but distinct neuronal subpopulations involved in fighting and mating. Neurons activated during attack are inhibited during mating, suggesting a potential neural substrate for competition between these opponent social behaviours.


Figures

Figure 1
Figure 1. Fos catFISH analysis of cell activation during fighting vs. mating
a-f, c-fos expression patterns following single (a, b) or two sequential (c-f) social interactions. Boxed areas are enlarged to right of each panel. Blue, Topro-3 nuclear counterstain. Red, c-fos cytoplasmic transcripts (cRNA probe); yellow dots, nuclear c-fos transcripts (red cRNA plus green intron probe signals). Scale bars: 10 μm. g, Percentage of total cells expressing c-fos after the 2nd behavior (nuclear signal) that also expressed c-fos after the 1st behavior (nuclear + cytoplasmic signal) (One-way ANOVA with Bonferroni correction). *P < 0.05, ** P < 0.01, *** P < 0.001.
Figure 2
Figure 2. Response patterns of a VMHvl neuron during social encounters
a, Video frames taken from consecutive trials with intruder animals of the indicated sex and strain. b-f, Average firing rate during indicated behavioral episodes from 5 exemplar cells. “Before,” prior to introducing stimulus animal; “No contact,” periods during encounter without physical contact between intruder and resident . Error bars: ± s.e.m. g, Recordings from the cell in (e) middle. Blue trace, superimposed individual spikes; red line, average spike shape. Scale bars: 200 μV, 200 μs. Raster plots illustrate 300 s of continuous recording. Colored shading and arrow mark manually annotated behavioral episodes. h, Schematics indicating cell response type at each recording site from Bregma level −1.35 mm to −1.65 mm. Anatomical structures based on Allen Brain Atlas (www.brain-map.org). fx: Fornix; ARH: Arcuate nucleus; v3: Third ventricle; TU: Tuberal nucleus.
Figure 3
Figure 3. Summary of cell responses in VMHvl during mating and fighting
a, b, Percentage of cells excited (red) or inhibited (blue) during encounters with male (a) or female (b) mice. c, Numbers of cells exhibiting statistically significant changes in firing rate (see Methods online) towards males or females. d, Firing rate changes for all 104 recorded cells, averaged over entire encounter with males or females. e, Firing rate changes averaged over all 104 recorded cells, during various behavioral episodes. Gray, behavior not applicable (N/A) to the stimulus animal.
Figure 4
Figure 4. Optogenetic activation of VMHvl elicits attack in mice
a, Schematic illustrating optic fiber placement; VMHvl shaded in blue. b-e, Fos induction (red) in EF1α::ChR2-EFYP-expressing (green) cells at 1 hr post-illumination. Fos+ cells outside EYFP+ region may be synaptic targets of ChR2-activated cells. Blue: Fluorescent Nissl stain. f, LacZ expression identifies infected cell bodies (red). Scale bar: 500 μm. g-j, LacZ expression (red) and native ChR2-EYFP fluorescence (green) largely overlaps. Boxed areas in (c, h) enlarged at lower right. Scale bars in (b-e, g-j): 50 μm or 10 μm (insets). k, Raster plots illustrating behavioral episodes (legend below) in a ChR2-expressing male paired with a female in 2 consecutive tests. l, Attack onset/offset latencies (relative to initiation vs. termination of illumination) towards indicated intruders **, P < 0.01). m, Efficacy of light-stimulated attack. “Optimized light intensity”: laser power yielding average maximal response in each animal (range: 1 - 3.3 mW/mm2). “1 mW/mm2”: average response obtained at this power. (t-test, P = 0.06). n, Percentage of animals attacking moving vs. non-moving anaesthetized animals or inflated glove (yellow shading). o, Percentage of trials inducing attacks towards female during successive stages of mating. * P < 0.05, ** P < 0.01 (One-way ANOVA with Bonferroni correction). p, Distribution of infected cells in each animal, plotted as cells per section in VMHvl posterior portion vs. that in (VMHdm + VMHc) region. Color code indicates whether illumination induced freeze/flight (green), attack (red) or no change in behavior (blue). See also Footnote S4 for further statistical analysis.
Figure 5
Figure 5. Reversible inhibition of natural aggression by genetic silencing of VMHvl
a, Anti-GFP antibody staining (green) in mice bilaterally infected with AAV2-GluClα + AAV2-GluClβ. Scale bar: 500 μm. b-e, Overlap between GluCl-expressing (green) and Fos-expressing (red) cells, 1hr after fighting. Blue: Topro-3 nuclear stain. Inset in (c) represents boxed area. Yellow cells are double-labeled. Scale bars: 50 μm or 10 μm (inset). f, g, Percent change in cumulative attack duration (f) and latency (g) during a 600 s resident-intruder trial before vs. 24 hr after IVM injection. Test: GluCl virus-injected animals (n = 33) (red bar). Control: no surgery (white bar, n = 12), saline (black bar, n = 6) or GluClß virus-injected animals (n = 12, gray bar) (**, P < 0.01, *, P < 0.05, t-test). h, Cumulative attack duration during repeated cycles of IVM injection or washout (*, P < 0.05, Bonferroni posttests of two-way ANOVA with repeated measures). Test: GluCl virus-injected animals (n = 12); Control: Saline (n = 6). i, j, Percent change in mount duration (i) or latency (j) in test (n = 12) vs. control (GluClß virus injected, n = 12) males paired with females. k. Percentage of infected cells in posterior portion of VMHvl (Bregma −1.4 mm — 1.8 mm) plotted against extent of aggression suppression after IVM injection. The Pearson correlation coefficient is significantly higher than 0 (P < 0.001). See Fig. S19 for further analysis.

Comment in

Similar articles

Cited by

References

    1. Tinbergen N. The study of instinct. xii. Clarendon Press/Oxford University Press; 1951.
    1. Hess WR. Stammganglien-Reizversuche. Berichte der gesamten. Physiologie. 1928;42
    1. Hess WR, Brügger M. Das subkortikale Zentrum der affecktiven Abwehr-reaktion. Helv. Physiol. Acta. 1943;I:33–52.
    1. Hrabovszky E, et al. Neurochemical characterization of hypothalamic neurons involved in attack behavior: glutamatergic dominance and co-expression of thyrotropin-releasing hormone in a subset of glutamatergic neurons. Neuroscience. 2005;133:657–666. - PubMed
    1. Kruk MR, et al. Discriminant analysis of the localization of aggression-inducing electrode placements in the hypothalamus of male rats. Brain Res. 1983;260:61–79. doi:0006-8993(83)90764-3 [pii] - PubMed

Publication types

MeSH terms