. 2011 Mar;41(3):760-72.
doi: 10.1002/eji.201040718. Epub 2011 Feb 10.

Amplification of cytokine production through synergistic activation of NFAT and AP-1 following stimulation of mast cells with antigen and IL-33

Affiliations

Amplification of cytokine production through synergistic activation of NFAT and AP-1 following stimulation of mast cells with antigen and IL-33

Marcus V Andrade et al. Eur J Immunol. 2011 Mar.

Abstract

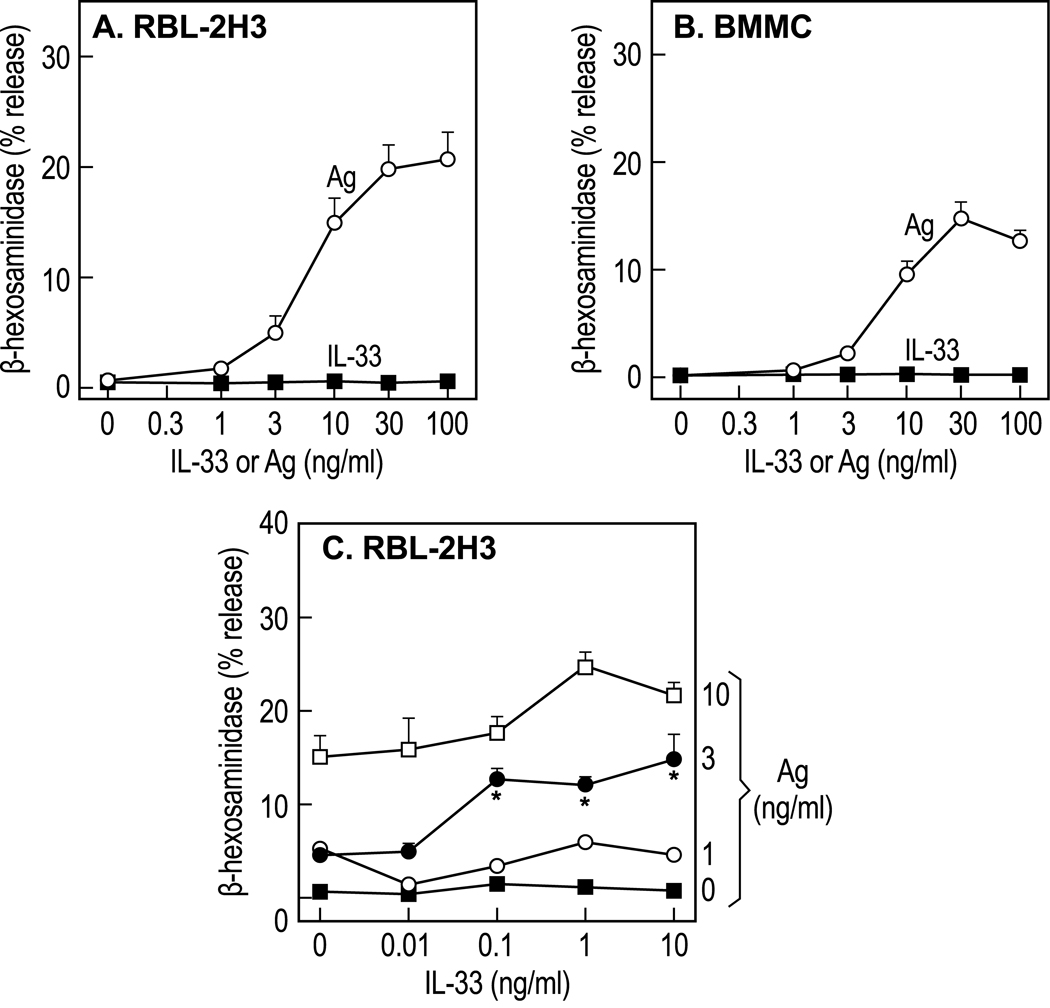
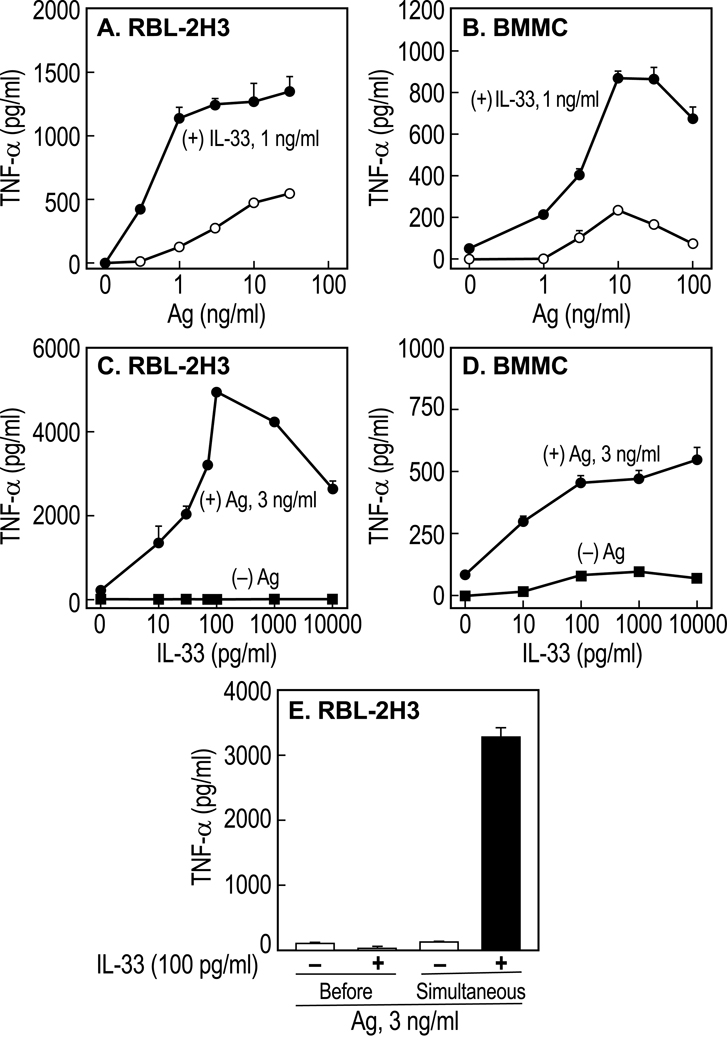
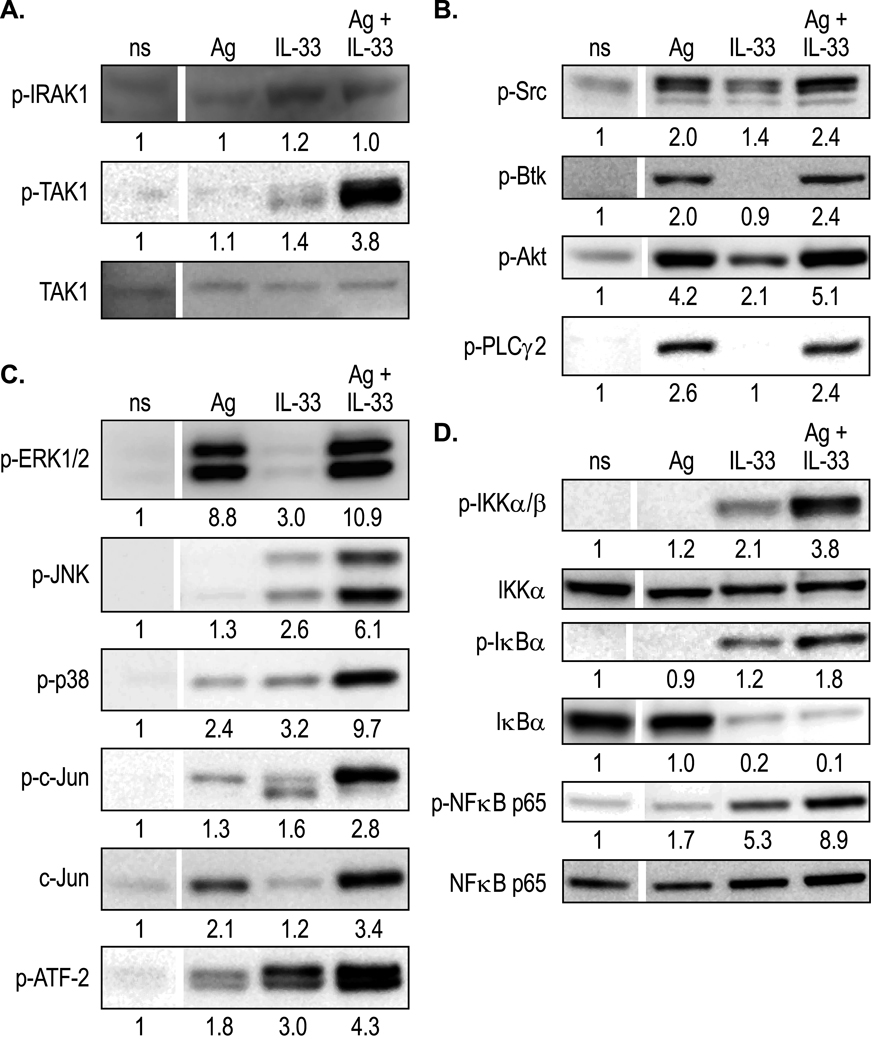
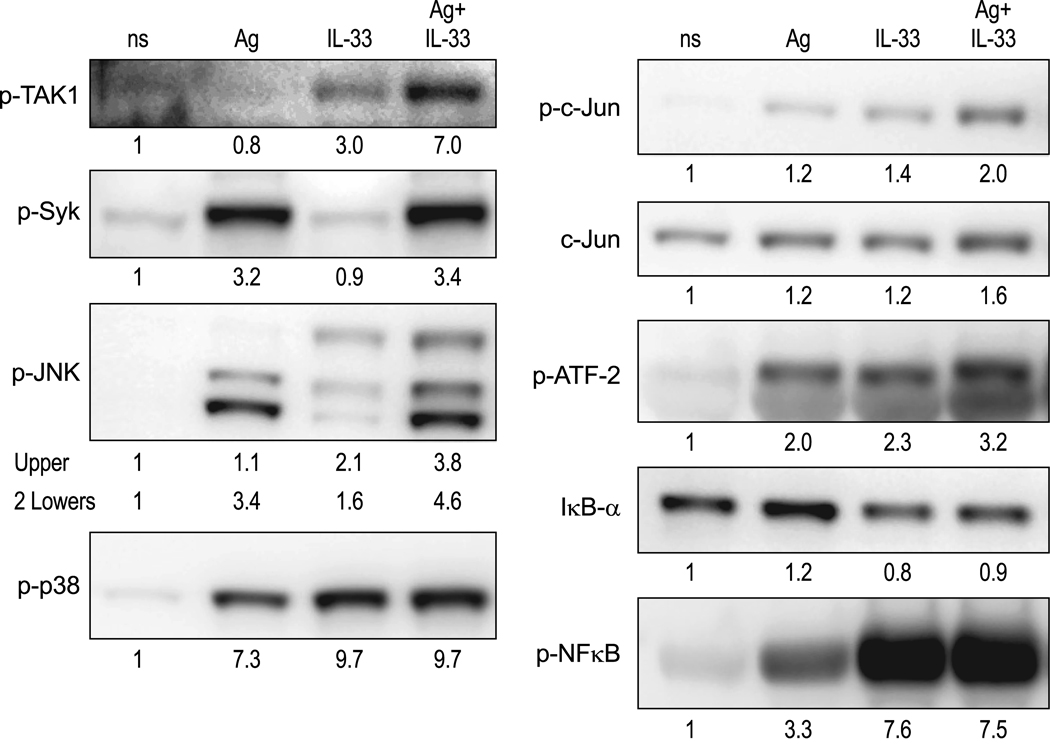
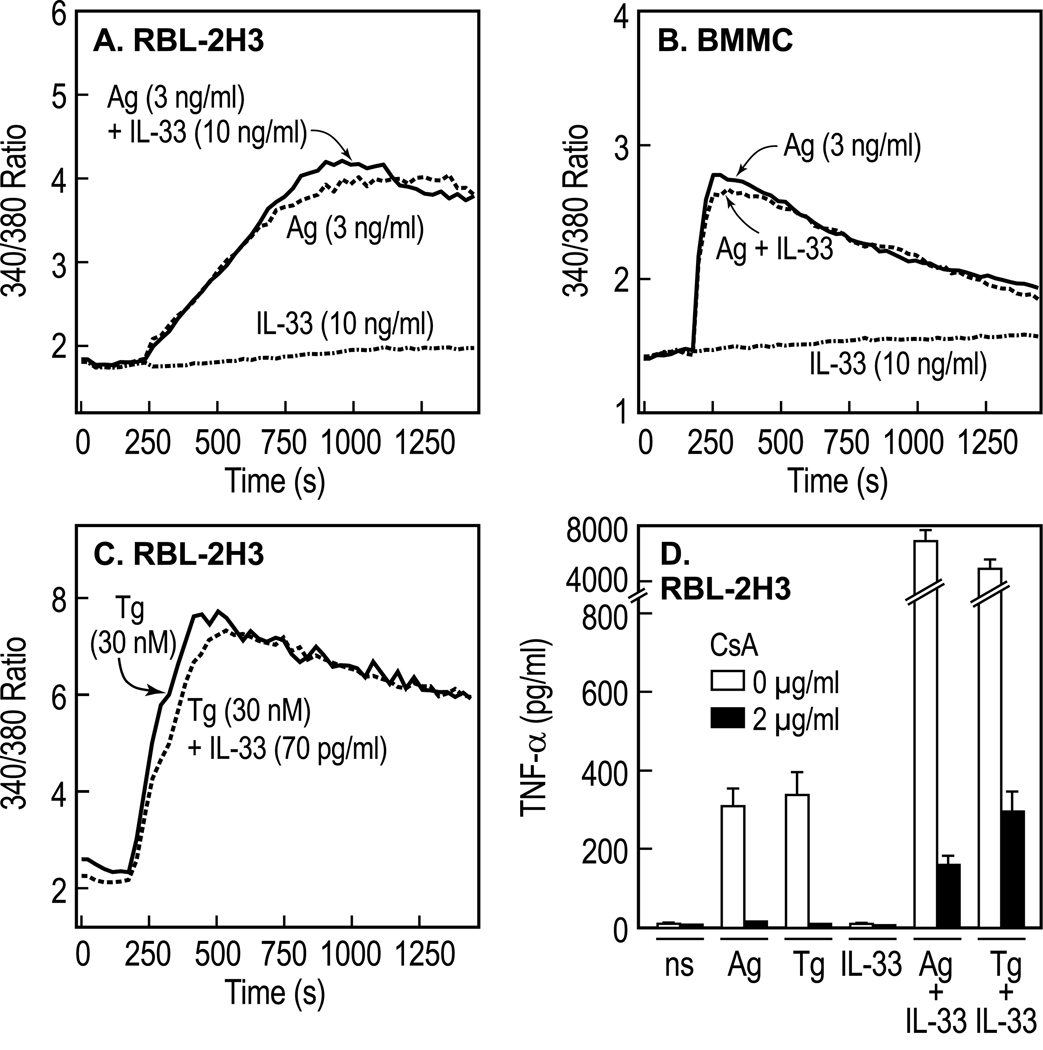
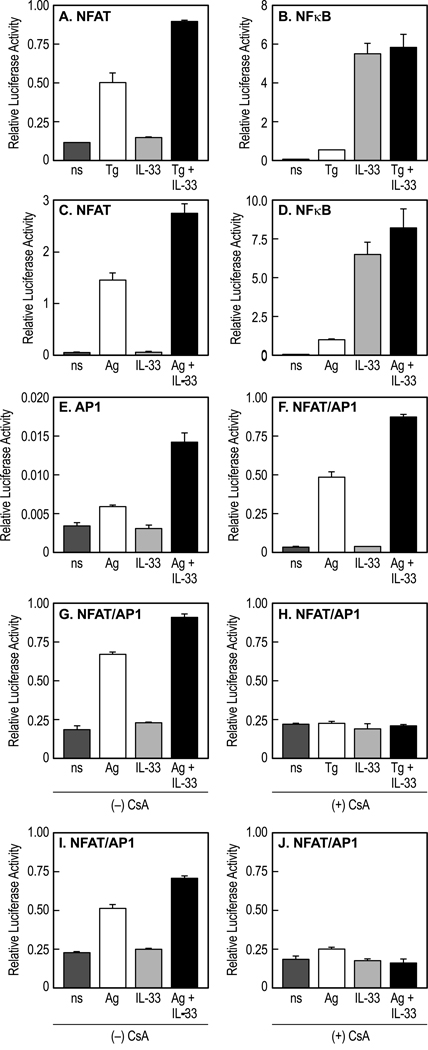
IL-33 is associated with atopic and autoimmune diseases and, as reported here, it interacts synergistically with Ag to markedly enhance production of inflammatory cytokines in rodent mast cells even in the absence of degranulation. Investigation of the underlying mechanisms revealed that synergy in signaling occurred at the level of TGF-β-activated kinase 1, which was then transmitted downstream through JNK, p38 MAP kinase, and AP-1. Stimulation of the Ca(2+) /calcineurin/NFAT pathway by Ag, which IL-33 did not, was critical for the synergy between Ag and IL-33. For example, selective stimulation of the NFAT pathway by thapsigargin also markedly enhanced responses to IL-33 in a calcineurin-dependent manner. As indicated by luciferase-reporter assays, IL-33 failed to stimulate the transcriptional activities of NFAT and AP-1 but augmented the activation of these transcription factors by Ag or thapsigargin. Robust stimulation of NF-κB transcriptional activity by IL-33 was also essential for the synergy. These and pharmacologic data suggested that the enhanced production of cytokines resulted in part from amplification of the activation of AP-1 and NFAT as well as co-operative interactions among transcription factors. IL-33 may retune mast cell responses to Ag toward enhanced cytokine production and thus determine the symptoms and severity of Ag-dependent allergic and autoimmune diseases.


Figures

Figure 1
Figure 1
L-33 fails to stimulate mast cell degranulation but modestly enhances Ag-induced degranulation. RBL-2H3 cells (A and C) and (B) BMMC, sensitized with Ag-specific IgE, were stimulated for 15 min with the indicated concentrations of IL-33, Ag, or both simultaneously. The data show per cent release of cellular β-hexosaminidase into medium. Values are the mean and SEM of values from 3 cultures and are typical of two or more similar experiments. Statistically significant increases in degranulation are indicated thus *, p<0.05; **, p<0.001.
Figure 2
Figure 2
Ag and IL-33 interact synergistically in the production of TNFα. Sensitized RBL-2H3 cells and BMMC were incubated for 3 h with the indicated concentrations of Ag, in the absence or presence of IL-33 (A and B), or the indicated concentrations of IL-33, in the absence or presence of Ag (C and D) before measurement of TNFα in the medium. For Panel E, cells were exposed to IL-33 for 16 h and then washed before stimulation with 3 ng/ml Ag (Before); alternatively cells were incubated for 16 h without IL-33, washed, and then stimulated simultaneously with IL-33 and Ag for 3 h (Simultaneous). Data depict mean and SEM of values from 3 cultures and are typical of two or more similar experiments. All differences were highly significant, p<0.001.
Figure 3
Figure 3
Ag and IL-33 interact synergistically in the production of several cytokines in wild type but not in MyD88-deficient BMMC. (A–F) BMMC were sensitized with Ag-specific IgE before stimulation or not (ns) with 3 ng/ml Ag or 70 pg/ml IL-33, individually or in combination, for 3 h. The indicated cytokines or chemokines were assayed by use of the Procarta assay kit as described in Materials and Methods. Data depict mean and SEM of values from 3 cultures and are typical of two similar experiments. (G–I) BMMC derived from wild type (WT) or MyD88−/− mice were sensitized with Ag-specific IgE before stimulation with 20 ng/ml Ag, 10 ng/ml IL-33, or both in combination. Note that these concentrations were higher than those used in panels A–F. Media were assayed for TNFα, IL-6, and IL-13 by ELISA 24 h later. Values are mean and SEM from 3 independent experiments except for panel I which shows mean values from 1 experiment. In all panels the differences between the sum of responses to individual stimulants and the response to the combination of stimulants were statistically significant at the p<0.05 (panels A to C) or p<0.01 (panels D to H) level.
Figure 4
Figure 4
Pattern of phosphorylation of signaling proteins in RBL-2H3 cells in response to Ag and IL-33 individually or in combination. RBL-2H3 cells sensitized with Ag-specific IgE were stimulated or not (ns) with 3 ng/ml Ag, 70 pg/ml IL-33, or both for 30 min. (A and B) Western blots were prepared from cell lysates for detection of phosphorylated rat IRAK1 (Thr 209), TAK1 (Thr 187), pan Src (Tyr 416), Btk (Ser 180), Akt (Ser 473), and PLCγ2 (Tyr 1217) as well as TAK1 protein. (C and D) Western blots were prepared from cell lysates to detect downstream phosphorylations which included phosphorylated rat ERK1/2 (Thr 202/Tyr 204), JNK (Thr 183/Tyr 185), p38 MAP kinase (Thr 180/Tyr 182), c-Jun (Ser 63), ATF-2 (Thr 69/71), and c-Jun protein. Blots were also probed for phosphorylated IKKα/β (Ser 176/180), IκBα (Ser 32), and NF-κB (Ser 536) and their protein counterparts. The blots shown were typical of results from three or more experiments and the numeric values indicate average density of bands from these experiments after correction for their protein counterparts. For this and the following figure, images were cropped to allow direct visual comparison of bands from non-stimulated and stimulated cells from the same gel.
Figure 5
Figure 5
Pattern of phosphorylation of signaling proteins in BMMC following stimulation with Ag and IL-33 individually in combination. Experiments were performed with sensitized BMMC as described for RBL-2H3 cells in Figure 4 except that cells were stimulated for 10 min. The blots shown were typical of results from two or more experiments and as for Figure 4 the numeric values indicate average corrected density of bands from these experiments.
Figure 6
Figure 6
IL-33 fails to mobilize Ca2+ but mobilization of Ca2+ upon stimulation with Ag or thapsigargin markedly potentiates TNFα production by IL-33 in a calcineurin-dependent manner. (A–C) RBL-2H3 cells or BMMC, sensitized with Ag-specific IgE, were stimulated with the indicated concentrations of Ag, IL-33, thapsigargin (Tg) or combinations thereof for measurement of changes in [Ca2+]i. (D) Sensitized cells were stimulated with 3 ng/ml Ag, 70 pg/ml IL-33, 30 nM thapsigargin, or the indicated combinations in the absence or presence of 2 µg/ml cyclosporin A (CsA). Cells were stimulated for the indicated times (A–C) or 90 min (D). Values are mean and SEM from 3 separate cultures and are representative or two or more experiments.
Figure 7
Figure 7
Stimulation of NFAT, NF-κB, and AP-1 transcriptional activity by thapsigargin, Ag, and IL-33 and the effects of cyclosporin A. Sensitized RBL-2H3 cells were stimulated or not (ns) with 30 nM thapsigargin (Tg), 3 ng/ml Ag, 70 pg/ml IL-33, or combinations thereof (A–F). In an additional set of experiments run in parallel, cyclosporin A (CsA, 2µg/ml) was added or not 10 min before addition of stimulants (G–J). Transcriptional activities were measured 90 min later by the dual luciferase reporter assay. Values are the mean and SEM from three to five separate experiments and are expressed as the ratio of firefly/Renilla luminescence activities. Statistical analyses indicated that stimulation of NFAT, NFκB, AP1, and NFAT/AP1 by Ag and that of NFAT and NFAT/AP1 by thapsigargin were highly significant (p<0.001) as was the stimulation of NFκB by IL-33. The enhancement of NFAT, AP1, and NFAT/AP1 activities by IL-33 in Ag- or thapsigargin- stimulated cells was also highly significant (p<0.001) except in the presence of cyclosporin A.
Figure 8
Figure 8
Suppression of TNFα production by knock-down of TAK1 and pharmacologic inhibitors of various signaling proteins. RBL-2H3 cells (A and B) and BMMC (C–E), sensitized with Ag-specific IgE, were stimulated with Ag and IL-33, individually or in combination, for 3 h for measurement of TNFα by ELISA. (A) Cells were transfected with scrambled control siRNA or anti-TAK1 siRNA 48 h before stimulation with 3 ng/ml Ag or 70 pg/ml IL-33. (B–E) Cells were exposed to the inhibitors for 20 min before addition of stimulants. Cells were stimulated with 3 ng/ml Ag and 70 pg/ml IL-33 (B) or at the concentrations indicated (C–E). Data are mean and SEM of values from 3 separate cultures and are representative of two separate experiments. Differences from controls are indicated thus *, p<0.05; **, p<0.001; ***, not detectable. Key for inhibitors in panels C–E: Ox, 100 nM 5Z-7-oxozeaenol; Bay, 10 µM Bay 11–7082; 10 µM SB 202190; 20 µM SP 600125; CsA, 2 µg/ml cyclosporin A.
Figure 9
Figure 9
Proposed mechanisms for amplification of cytokine gene transcription on co-stimulation of mast cells with low concentrations of Ag (or thapsigargin) and IL-33. Phosphorylation of TAK1 by IL-33 via the ST2/IL-1 receptor accessory protein (IL-1RAcP) complex, MyD88, the IRAKs, and TRAF6 is amplified by Ag via FcεRI by an as yet undetermined mechanism. This results in enhanced phosphorylation of p38 MAP kinase and JNK and, in turn, phosphorylation of ATF-2 and c-Jun (Fig. 4). Enhancement of phosphorylation events throughout the NFκB pathway were also observed (Fig. 4) but this did not result in detectable augmentation of NFκB transcriptional activity as determined by luciferase assays (Fig. 7). Synergy was not apparent in the phosphorylation of PLCγ (Fig. 4B) and calcium mobilization, whether initiated by Ag or thapsigargin (Tg) (Fig. 6A–C), but amplification of NFAT activation was noted (Fig. 7). Studies with cyclosporin A, an inhibitor of calcineurin that dephosphorylates and hence activates NFAT, indicate that the Ca2+/calcineurin/NFAT pathway is necessary for TNFα-gene transcription (Fig. 6D) and the activation of NFAT/AP1 (Fig. 7G–J) to suggest essential co-operative interactions between NFAT and AP1. In total, the data suggest that Ag and IL-33 together recruit a more effective combination of transcription factors and an essential role for NFAT.

References

    1. Beaven MA. Our perception of the mast cell from Paul Ehrlich to now. Eur.J.Immunol. 2009;39:11–25. - PMC - PubMed
    1. Kalesnikoff J, Galli SJ. New developments in mast cell biology. Nat.Immunol. 2008;9:1215–1223. - PMC - PubMed
    1. Kuehn HS. and Gilfillan,A.M., G protein-coupled receptors and the modification of FceRI-mediated mast cell activation. Immunol.Lett. 2007;113:59–69. - PMC - PubMed
    1. Qiao H, Andrade MV, Lisboa FA, Morgan K, Beaven MA. FceRI and Toll-like receptors mediate synergistic signals to markedly augment production of inflammatory cytokines in murine mast cells. Blood. 2006;107:610–618. - PMC - PubMed
    1. Galli SJ, Kalesnikoff J, Grimbaldeston MA, Piliponsky AM, Williams CM, Tsai M. Mast cells as "tunable" effector and immunoregulatory cells: Recent Advances. Annu.Rev.Immunol. 2005;23:749–786. - PubMed

Publication types

MeSH terms