

Megakaryocyte lineage-specific class VI β-tubulin suppresses microtubule dynamics, fragments microtubules, and blocks cell division
- PMID: 21309084
- PMCID: PMC3082363
- DOI: 10.1002/cm.20503
Megakaryocyte lineage-specific class VI β-tubulin suppresses microtubule dynamics, fragments microtubules, and blocks cell division
Abstract
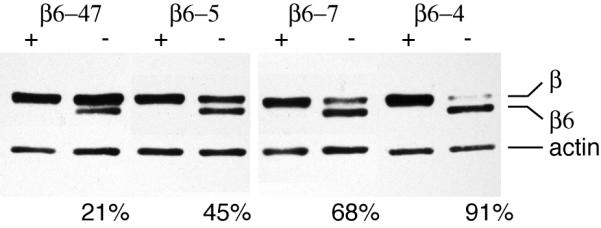
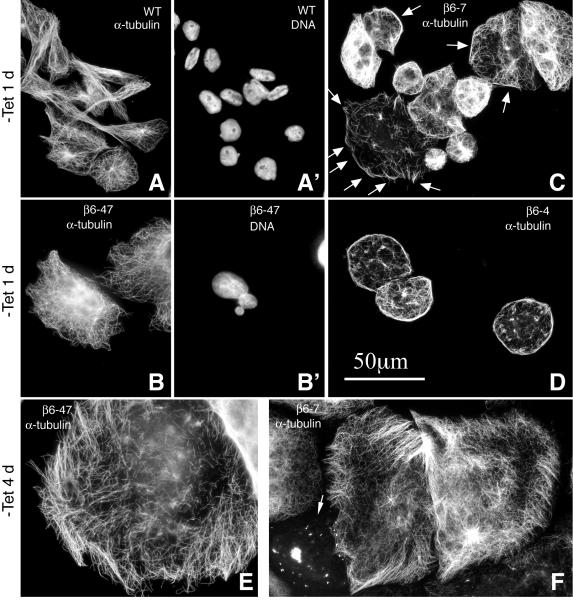
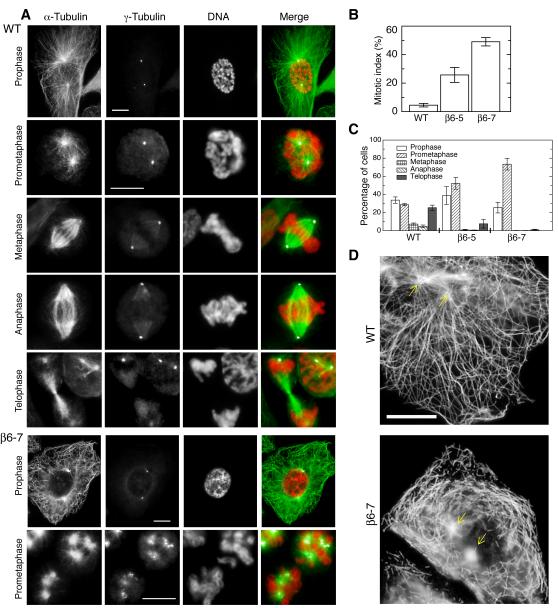
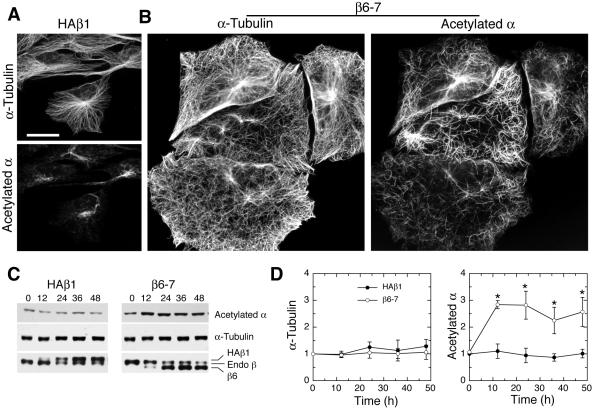
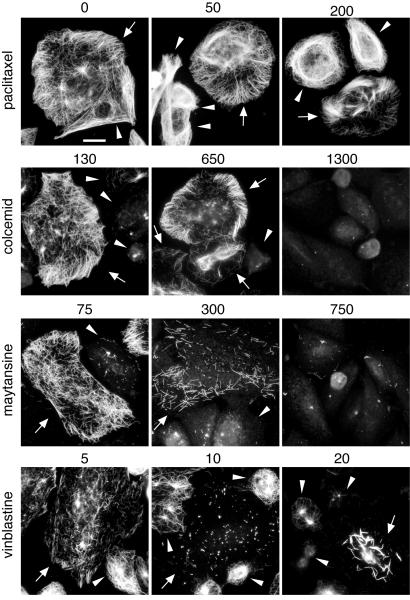
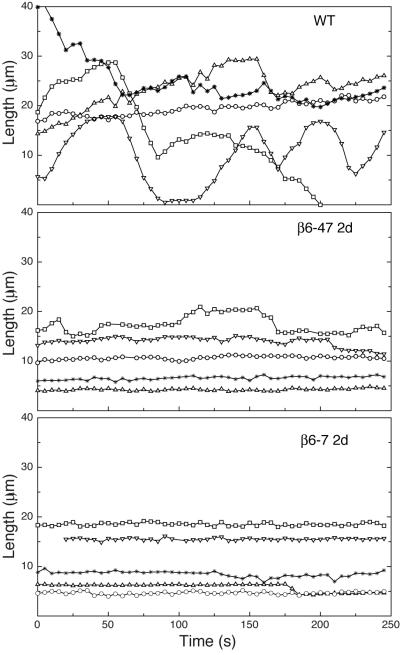
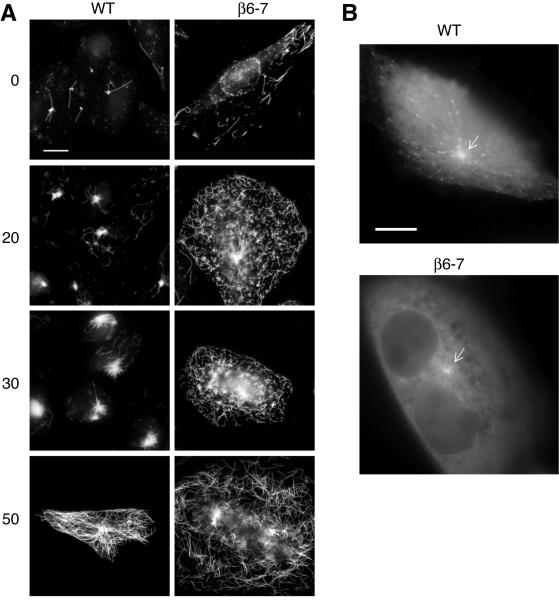
Class VI β-tubulin (β6) is the most divergent tubulin produced in mammals and is found only in platelets and mature megakaryocytes. To determine how this unique tubulin isotype affects microtubule assembly and organization, we expressed the cDNA in tissue culture cells under the control of a tetracycline regulated promoter. The β6 coassembled with other endogenous β-tubulin isotypes into a normal microtubule array; but once the cells entered mitosis it caused extensive fragmentation of the microtubules, disrupted the formation of the spindle apparatus, and allowed entry into G1 phase without cytokinesis to produce large multinucleated cells. The microtubule fragments persisted into subsequent cell cycles and accumulated around the membrane in a marginal band-like appearance. The persistence of the fragments could be traced to a pronounced suppression of microtubule dynamic instability. Impairment of centrosomal nucleation also contributed to the loss of a normal microtubule cytoskeleton. Incorporation of β6 allowed microtubules to resist the effects of colcemid and maytansine, but not vinblastine or paclitaxel; however, cellular resistance to colcemid or maytansine did not occur because expression of β6 prevented cell division. The results indicate that many of the morphological features of megakaryocyte differentiation can be recapitulated in non-hematopoietic cells by β6 expression and they provide a mechanistic basis for understanding these changes.
Copyright © 2011 Wiley-Liss, Inc.
Figures
Similar articles
-
Amino acid substitutions at proline 220 of beta-tubulin confer resistance to paclitaxel and colcemid.Mol Cancer Ther. 2007 Oct;6(10):2798-806. doi: 10.1158/1535-7163.MCT-06-0791. Mol Cancer Ther. 2007. PMID: 17938271
-
Inhibition of cell migration and cell division correlates with distinct effects of microtubule inhibiting drugs.J Biol Chem. 2010 Oct 15;285(42):32242-50. doi: 10.1074/jbc.M110.160820. Epub 2010 Aug 9. J Biol Chem. 2010. PMID: 20696757 Free PMC article.
-
Overexpression of mitotic centromere-associated Kinesin stimulates microtubule detachment and confers resistance to paclitaxel.Mol Cancer Ther. 2011 Jun;10(6):929-37. doi: 10.1158/1535-7163.MCT-10-1109. Epub 2011 Apr 6. Mol Cancer Ther. 2011. PMID: 21471284 Free PMC article.
-
Modulation of microtubule dynamics by drugs: a paradigm for the actions of cellular regulators.Cell Struct Funct. 1999 Oct;24(5):329-35. doi: 10.1247/csf.24.329. Cell Struct Funct. 1999. PMID: 15216890 Review.
-
Tubulin as a target for anticancer drugs: agents which interact with the mitotic spindle.Med Res Rev. 1998 Jul;18(4):259-96. doi: 10.1002/(sici)1098-1128(199807)18:4<259::aid-med3>3.0.co;2-u. Med Res Rev. 1998. PMID: 9664292 Review.
Cited by
-
Regulation of Tubulin Gene Expression: From Isotype Identity to Functional Specialization.Front Cell Dev Biol. 2022 May 26;10:898076. doi: 10.3389/fcell.2022.898076. eCollection 2022. Front Cell Dev Biol. 2022. PMID: 35721507 Free PMC article. Review.
-
Class III β-tubulin counteracts the ability of paclitaxel to inhibit cell migration.Oncotarget. 2011 May;2(5):368-77. doi: 10.18632/oncotarget.250. Oncotarget. 2011. PMID: 21576762 Free PMC article.
-
Microtubule polyglutamylation and acetylation drive microtubule dynamics critical for platelet formation.BMC Biol. 2018 Oct 18;16(1):116. doi: 10.1186/s12915-018-0584-6. BMC Biol. 2018. PMID: 30336771 Free PMC article.
-
Microtubule Hyperacetylation Enhances KL1-Dependent Micronucleation under a Tau Deficiency in Mammary Epithelial Cells.Int J Mol Sci. 2018 Aug 23;19(9):2488. doi: 10.3390/ijms19092488. Int J Mol Sci. 2018. PMID: 30142893 Free PMC article.
-
The arresting action of microtubules in cell motility.Cell Cycle. 2011 Aug 15;10(16):2614-5. doi: 10.4161/cc.10.16.16593. Epub 2011 Aug 15. Cell Cycle. 2011. PMID: 21778828 Free PMC article. No abstract available.
References
-
- Ahmad S, Singh B, Gupta RS. Nucleotide sequences of three different isoforms of beta-tubulin cDNA from Chinese hamster ovary cells. Biochim Biophys Acta. 1991;1090:252–254. - PubMed
-
- Akhmanova A, Steinmetz MO. Tracking the ends: a dynamic protein network controls the fate of microtubule tips. Nat Rev Mol Cell Biol. 2008;9:309–322. - PubMed
Publication types
MeSH terms
Substances
Grants and funding
LinkOut - more resources
Full Text Sources
Research Materials
