

The relationship between maternal glycemia and perinatal outcome
- PMID: 21309194
- PMCID: PMC3979319
- DOI: 10.1097/AOG.0b013e318203ebe0
The relationship between maternal glycemia and perinatal outcome
Abstract
Objective: To examine the relationship between varying degrees of maternal hyperglycemia and pregnancy outcomes.
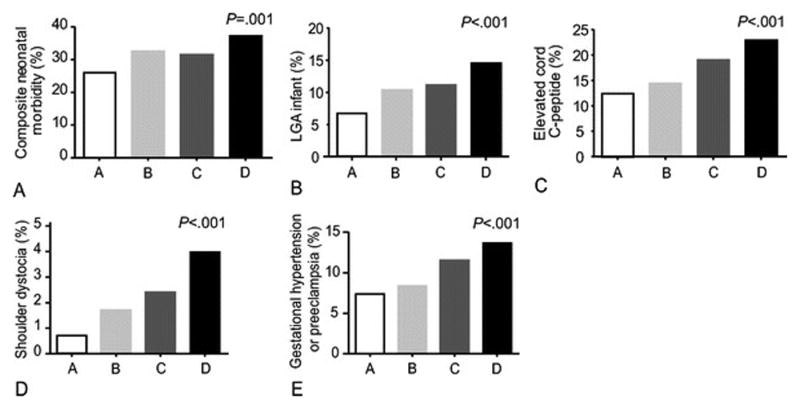
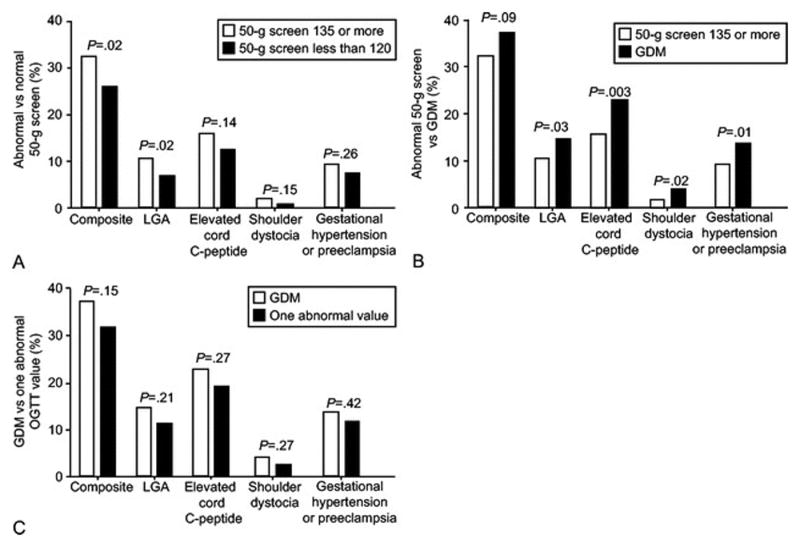
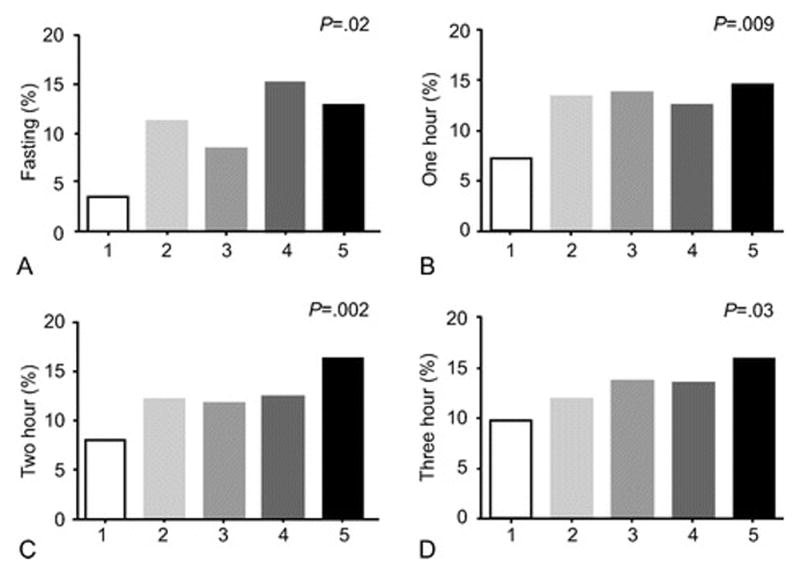
Methods: This was a secondary analysis of a treatment trial for mild gestational diabetes including four cohorts: 1) 473 women with untreated mild gestational diabetes; 2) 256 women with a positive 50-g screen and one abnormal oral glucose tolerance test (OGTT) value; 3) 675 women with a positive screen and no abnormal OGTT values; and 4) 437 women with a normal 50-g screen. Groups were compared by test of trend for a composite perinatal outcome (neonatal hypoglycemia, hyperbilirubinemia, elevated cord C-peptide level, and perinatal trauma or death), frequency of large for gestational age neonates, shoulder dystocia, and pregnancy-related hypertension. Three-hour OGTT levels (fasting, 1-, 2-, and 3-hour) levels were divided into categories and analyzed for their relationship to perinatal and maternal outcomes.
Results: There were significant trends by glycemic status among the four cohorts for the composite and all other outcomes (P<.001). Analysis for trend according to OGTT categories showed an increasing relationship between fasting and all postload levels and the various outcomes (P<.05). Fasting glucose 90 mg/dL or greater and 1 hour 165 mg/dL or greater were associated with an increased risk for the composite outcome (odds ratios and 95% confidence intervals of 2.0 [1.03–4.15] and 1.46 [1.02–2.11] to 1.52 [1.08–2.15] for the fasting and 1 hour, respectively). A 1 hour glucose 150 mg/dL or greater was associated with an increased risk for large for gestational age (odds ratios, 1.8 [1.02–3.18] to 2.35 [1.35–4.14]); however, 2- and 3-hour glucose levels did not increase the risk for the composite or large for gestational age until well beyond current gestational diabetes diagnostic thresholds.
Conclusion: A monotonic relationship exists between increasing maternal glycemia and perinatal morbidity. Current OGTT criteria require reevaluation in determining thresholds for the diagnosis and treatment of gestational diabetes.
Level of evidence: II
Figures
Comment in
-
The relationship between maternal glycemia and perinatal outcome.Obstet Gynecol. 2011 May;117(5):1230. doi: 10.1097/AOG.0b013e3182176774. Obstet Gynecol. 2011. PMID: 21508777 No abstract available.
-
Diabetes: criteria for the diagnosis and treatment of gestational diabetes mellitus--time for a change.Nat Rev Endocrinol. 2011 Apr;7(4):185. doi: 10.1038/nrendo.2011.21. Nat Rev Endocrinol. 2011. PMID: 21548174 No abstract available.
References
-
- Chen Y, Quick WW, Yang W, Zhang Y, Baldwin A, et al. Cost of gestational diabetes in the United States in 2007. Population Health Management. 2009;12:165–174. - PubMed
-
- Sermer M, Naylor D, Phil D, Gare DJ, et al. for the Toronto Tri-Hospital Gestational Diabetes Investigators. Impact of increasing carbohydrate intolerance on maternal-fetal outcomes in 3637 women without gestational diabetes. Am J Obstet Gynecol. 1995;173:146–56. - PubMed
-
- The HAPO Study Cooperative Research Group. Hyperglycemia and adverse pregnancy outcomes. N Engl J Med. 2008;358:1991–2002. - PubMed
-
- Dodd JM, Crowther CA, Antoniou G, Baghurst P, Robinson JS. Screening for gestational diabetes: The effect of varying blood glucose definitions in the prediction of adverse maternal and infant health outcomes. Aust NZ J Obstet Gynaecol. 2007;47:307–12. - PubMed
Publication types
MeSH terms
Substances
Grants and funding
- HD36801/HD/NICHD NIH HHS/United States
- U10 HD040544/HD/NICHD NIH HHS/United States
- U10 HD034136/HD/NICHD NIH HHS/United States
- U10 HD040485/HD/NICHD NIH HHS/United States
- UL1-RR024989/RR/NCRR NIH HHS/United States
- HD40485/HD/NICHD NIH HHS/United States
- HD40560/HD/NICHD NIH HHS/United States
- U01 HD036801/HD/NICHD NIH HHS/United States
- U10 HD053118/HD/NICHD NIH HHS/United States
- UL1 RR024989/RR/NCRR NIH HHS/United States
- U10 HD040500/HD/NICHD NIH HHS/United States
- M01-RR00034/RR/NCRR NIH HHS/United States
- UG1 HD027869/HD/NICHD NIH HHS/United States
- M01 RR000034/RR/NCRR NIH HHS/United States
- UL1-RR025764/RR/NCRR NIH HHS/United States
- UL1 RR025764/RR/NCRR NIH HHS/United States
- UG1 HD034116/HD/NICHD NIH HHS/United States
- HD27869/HD/NICHD NIH HHS/United States
- HD34136/HD/NICHD NIH HHS/United States
- UG1 HD040560/HD/NICHD NIH HHS/United States
- HD53118/HD/NICHD NIH HHS/United States
- UG1 HD053097/HD/NICHD NIH HHS/United States
- HD27860/HD/NICHD NIH HHS/United States
- UG1 HD027915/HD/NICHD NIH HHS/United States
- HD40512/HD/NICHD NIH HHS/United States
- UG1 HD040544/HD/NICHD NIH HHS/United States
- UG1 HD034208/HD/NICHD NIH HHS/United States
- UG1 HD040512/HD/NICHD NIH HHS/United States
- HD40545/HD/NICHD NIH HHS/United States
- U10 HD034116/HD/NICHD NIH HHS/United States
- HD21410/HD/NICHD NIH HHS/United States
- U10 HD027869/HD/NICHD NIH HHS/United States
- U10 HD027917/HD/NICHD NIH HHS/United States
- HD34116/HD/NICHD NIH HHS/United States
- U10 HD027915/HD/NICHD NIH HHS/United States
- UG1 HD040545/HD/NICHD NIH HHS/United States
- UG1 HD040485/HD/NICHD NIH HHS/United States
- U10 HD027860/HD/NICHD NIH HHS/United States
- HD40500/HD/NICHD NIH HHS/United States
- C06 RR011234/RR/NCRR NIH HHS/United States
- U10 HD040560/HD/NICHD NIH HHS/United States
- U10 HD034208/HD/NICHD NIH HHS/United States
- U10 HD053097/HD/NICHD NIH HHS/United States
- HD34208/HD/NICHD NIH HHS/United States
- HD27915/HD/NICHD NIH HHS/United States
- UG1 HD040500/HD/NICHD NIH HHS/United States
- M01-RR00080/RR/NCRR NIH HHS/United States
- R24 HD050924/HD/NICHD NIH HHS/United States
- U10 HD040512/HD/NICHD NIH HHS/United States
- HD27917/HD/NICHD NIH HHS/United States
- U10 HD021410/HD/NICHD NIH HHS/United States
- M01 RR000080/RR/NCRR NIH HHS/United States
- U24 HD036801/HD/NICHD NIH HHS/United States
- U10 HD036801/HD/NICHD NIH HHS/United States
- HD53097/HD/NICHD NIH HHS/United States
- U10 HD040545/HD/NICHD NIH HHS/United States
- HD40544/HD/NICHD NIH HHS/United States
LinkOut - more resources
Full Text Sources
Medical
Research Materials
