. 2011 Feb 11:12:106.
doi: 10.1186/1471-2164-12-106.

Identification of errors introduced during high throughput sequencing of the T cell receptor repertoire

Affiliations

Identification of errors introduced during high throughput sequencing of the T cell receptor repertoire

Phuong Nguyen et al. BMC Genomics. .

Abstract

Background: Recent advances in massively parallel sequencing have increased the depth at which T cell receptor (TCR) repertoires can be probed by >3log10, allowing for saturation sequencing of immune repertoires. The resolution of this sequencing is dependent on its accuracy, and direct assessments of the errors formed during high throughput repertoire analyses are limited.

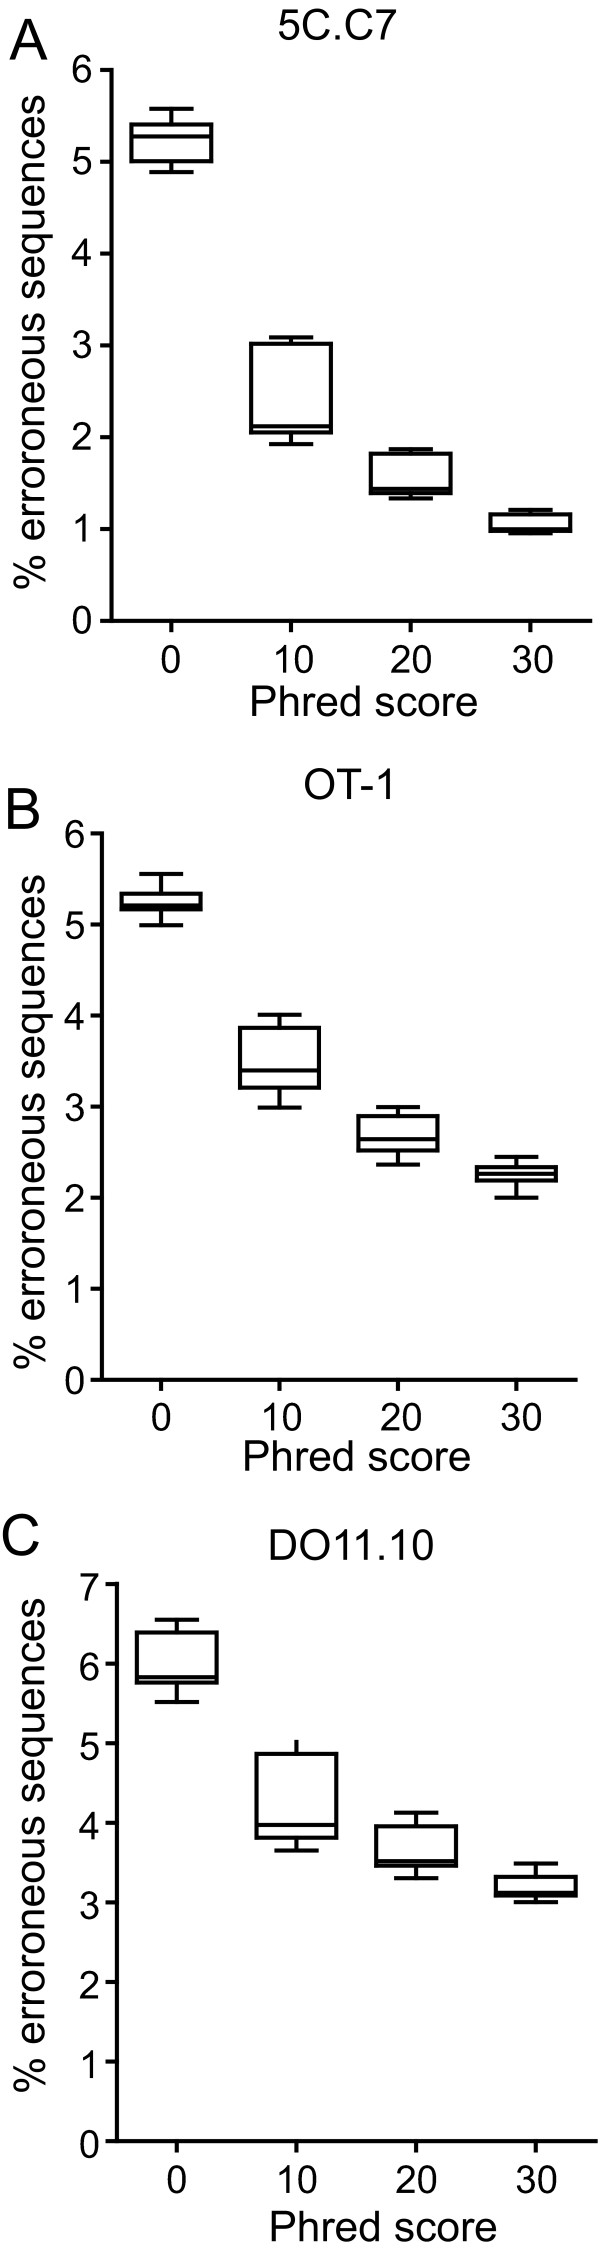
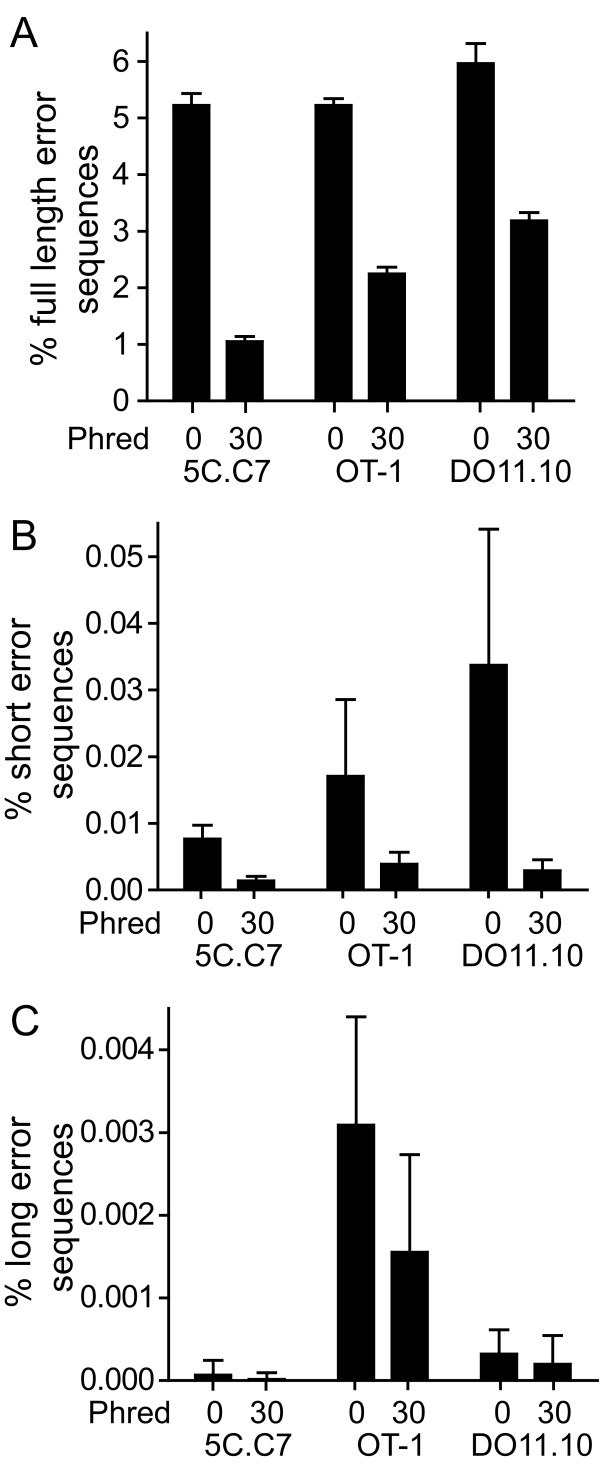
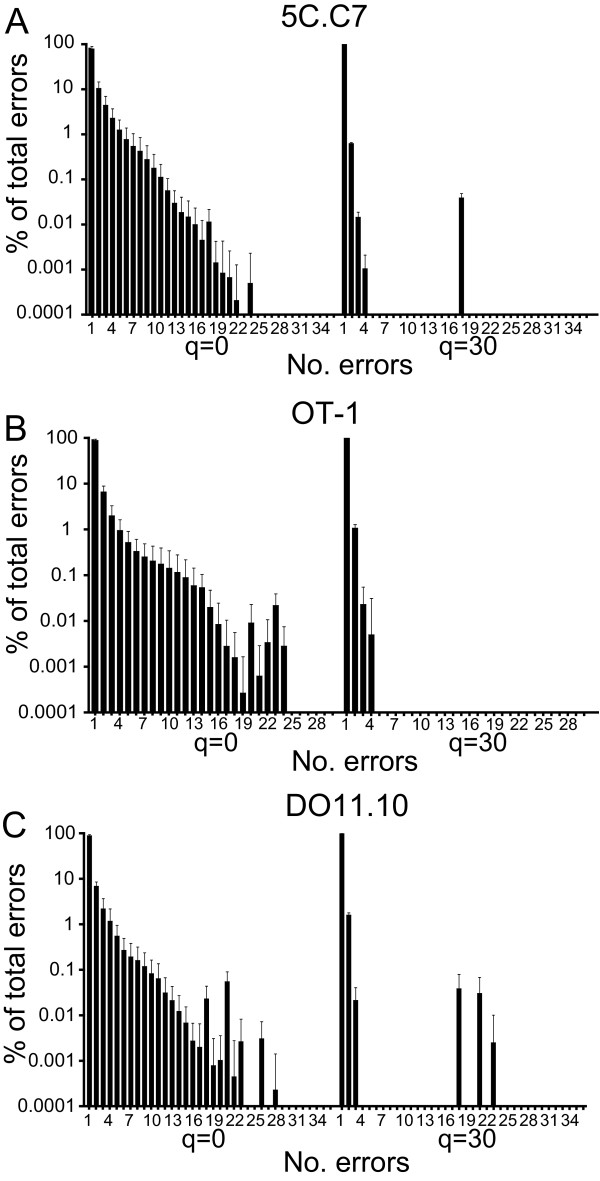
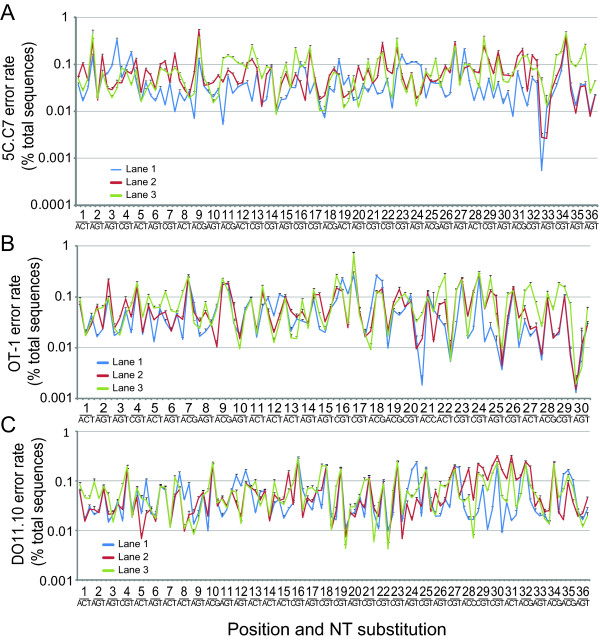
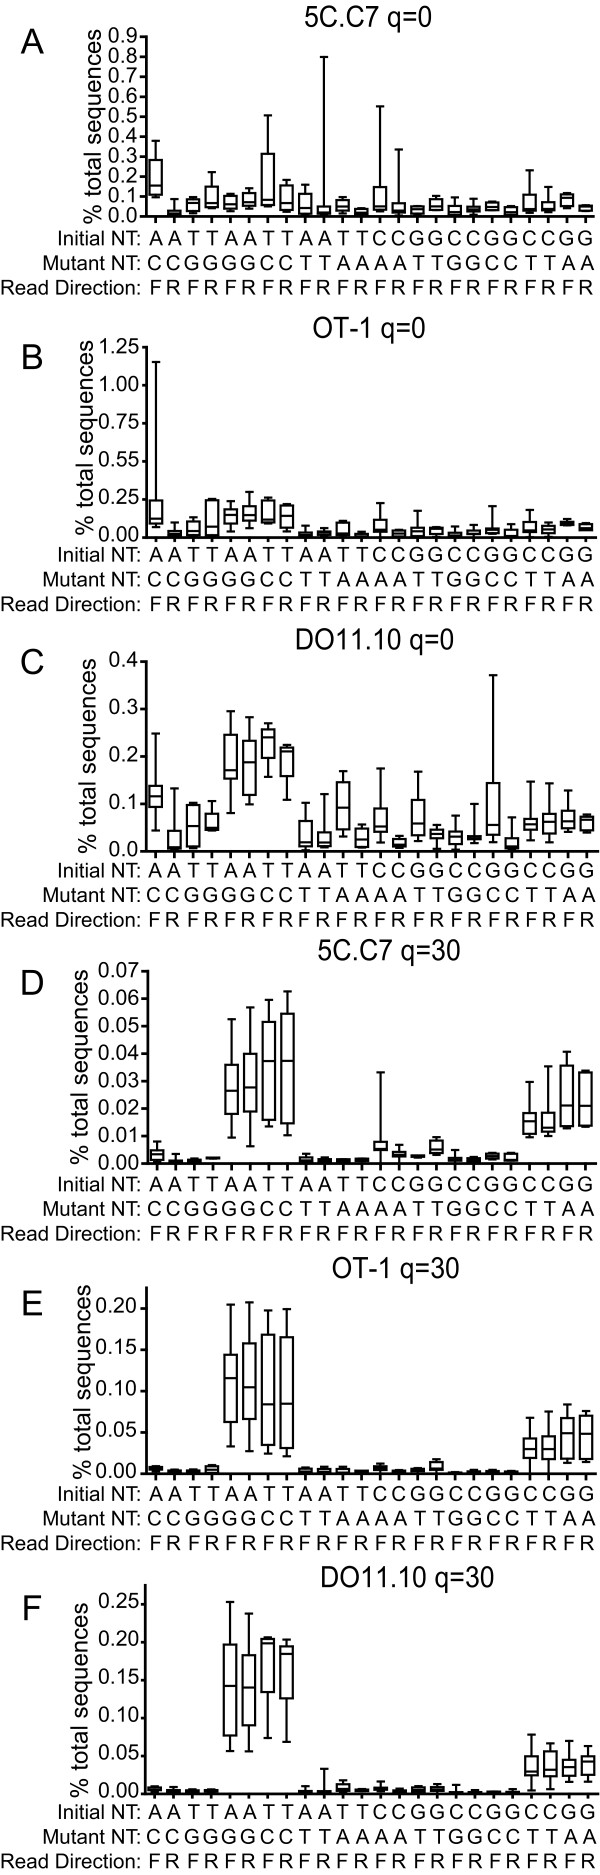
Results: We analyzed 3 monoclonal TCR from TCR transgenic, Rag-/- mice using Illumina® sequencing. A total of 27 sequencing reactions were performed for each TCR using a trifurcating design in which samples were divided into 3 at significant processing junctures. More than 20 million complementarity determining region (CDR) 3 sequences were analyzed. Filtering for lower quality sequences diminished but did not eliminate sequence errors, which occurred within 1-6% of sequences. Erroneous sequences were pre-dominantly of correct length and contained single nucleotide substitutions. Rates of specific substitutions varied dramatically in a position-dependent manner. Four substitutions, all purine-pyrimidine transversions, predominated. Solid phase amplification and sequencing rather than liquid sample amplification and preparation appeared to be the primary sources of error. Analysis of polyclonal repertoires demonstrated the impact of error accumulation on data parameters.

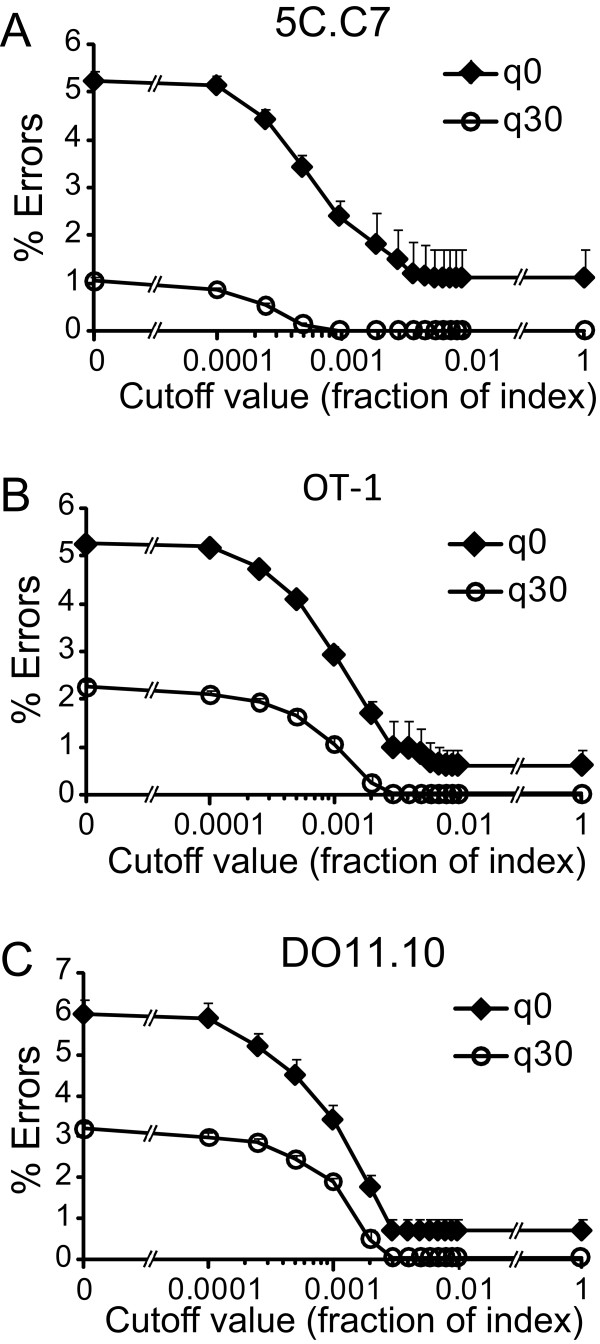
Conclusions: Caution is needed in interpreting repertoire data due to potential contamination with mis-sequence reads. However, a high association of errors with phred score, high relatedness of erroneous sequences with the parental sequence, dominance of specific nt substitutions, and skewed ratio of forward to reverse reads among erroneous sequences indicate approaches to filter erroneous sequences from repertoire data sets.


Figures

Figure 1
Figure 1
Error rate of sequencing reactions. Box and whisker plots show median, 25-75 percentile, and range for erroneous sequences for the 5C.C7 (A), OT-1 (B), and DO11.10 (C) CDR3 sequences expressed as a percent of total sequence events that met initial criteria. Phred values were used to further constrain sequence sets and the minimal phred cutoff score for any nt in a sequence is indicated.
Figure 2
Figure 2
Length of erroneous sequences. Mean+1 S.D. of the percent of total sequences of errors of same length (A), shortened (B), and elongated (C) compared with the correct sequence is plotted. Sequences filtered for a minimal phred score of 30 for each nt is compared with sequences not filtered for phred value.
Figure 3
Figure 3
Multiple errors in CDR3 sequences. Plot shows mean+1 s.d. of the frequency of correct-length erroneous sequences with the indicated number of nt substitutions as a percent of the total correct-length erroneous sequences for the 5C.C7 (A), OT-1 (B), and DO11.10 TCR, and with phred cutoff scores of 0 or 30.
Figure 4
Figure 4
Complementation in error occurrence. An expected frequency of multiple errors was calculated based on the assumption that each error is independent using the formula p = C(SER)M, where SER = observed single error rate, M = number of mutated nt in sequence, and C = total number of possible erroneous sequence combinations. C = N!/(M!x(N-M)!), where N = number of nucleotides in the sequence. The expected frequency of multiple mutations is plotted against the observed frequency in experimental samples either for data sets not filtered based on phred score or filtered at a q = 30, and for the presence of between 2 and 10 mutated nt for q = 0 and 2 and 4 for q = 30 (no events were observed with 4-10 mutations for q = 30 filtered data).
Figure 5
Figure 5
Filtering single nt mismatch sequences from repertoire data. To determine the extent to which errors could be purged by filtering sequences with single nt mismatches, we examined the residual percent of erroneous sequences for each sequencing reaction after culling single nt mismatch sequences. Assessment of residual erroneous sequences was performed at multiple cutoff values for the frequency of the mismatch sequence relative to the true 5C.C7 (A), OT-1 (B), or DO11.10 (C) sequence, and mean + 1 s.d. plotted. Our data suggests values of less than 0.01 are adequate for optimal error reduction. In application, a cutoff would need to be selected that optimizes removal of erroneous sequences while also minimizing inadvertent culling of true sequences.
Figure 6
Figure 6
Position and nt specific substitutions. The frequency of sequences with the indicated nt substitutions among total acquired, phred unfiltered sequences is plotted for 5C.C7 (A), OT-1 (B), and DO11.10 TCR (C). Mean+1 s.d. of 9 samples per lane is plotted for each of the 3 sequencing lanes to highlight lane-specific differences in position/nt error rates. Plotted lines are shown to aid visualization of results from single lanes and do not indicate continuity among x-axis variables.
Figure 7
Figure 7
Skewing in sequence read direction. The number of reads performed in a forward or reverse orientation were tabulated for each phred unfiltered, erroneous sequence for which a total of >20 independent sequences were acquired in a lane. Percent forward reads is plotted on the ordinate versus number of sequences acquired in the abscissa. If read direction during sequencing was random, data points would be anticipated to fall within a binomial distribution centered on the value obtained for correct sequence reads. Plotted curves indicate calculated boundaries of the upper and lower limits of values between which 98% of sequences should be found. These were calculated using the Vassar binomial calculator http://faculty.vassar.edu/lowry/binomialX.html with p = probability of forward read among correct sequences, n = number of reads (abscissa), and defining the number of positive events for which the probability of identifying more events (upper curve) or less events (lower curve) is <1%. Plots for full length sequences with a single error for the 5C.C7, OT-1, and DO11.10 TCR (A-C), and corresponding plots for sequences with multiple errors (D-F) are shown.
Figure 8
Figure 8
Rates of specific nt substitutions. Rates of the indicated nt substitutions at individual positions were tabulated separately for forward and reverse direction reads. The average rate of a given substitution per position bearing the indicated initial nt within 5C.C7 (A, D), OT-1 (B, E), and DO11.10 (C, F) sequence sets was calculated. The median (line), 25-75 percentile error rate (box), and range (whiskers) of this for the 27 sequencing reactions per TCR are plotted for phred unfiltered (A-C) or q = 30 (D-F) filtered sequences.
Figure 9
Figure 9
Analysis of polyclonal C57BL/6 repertoires. In 2 independent analyses, C57BL/6 splenocytes were sorted into CD4+GFP-Foxp3- and CD4+GFP-Foxp3+ populations and the Vβ8.2 TCR repertoire analyzed. Frequency of total (A) and unique (B) sequences acquired for each analysis without or with filtering sequences at q = 30. For each unique sequence acquired, sequences present at lower frequency with a single nt mismatch were tabulated. For the 20 most frequent sequences in each cohort, the total number of single nt mismatch sequences present at less than the indicated frequency (abscissa) relative to each corresponding high frequency index sequence were tallied. The total number of these presumed erroneous sequences for the Foxp3- (C) and Foxp3+ (D) populations either analyzed without filtering or filtered at a q = 30 are plotted (ordinate). Results demonstrate a decreased number of presumed erroneous sequences after applying a q = 30 filter. (E) For each unique sequence, the total number of other unique sequences present at a lower frequency and with a single nt mismatch was tallied. The number of these single mismatch sequences was summed for all sequences within each cohort with or without q = 30 filtering. (F) ACE values were calculated as estimates of total repertoire diversity in populations either with or without q = 30 filtering.

References

    1. Casrouge A, Beaudoing E, Dalle S, Pannetier C, Kanellopoulos J, Kourilsky P. Size estimate of the alpha beta TCR repertoire of naive mouse splenocytes. J Immunol. 2000;164:5782–5787. - PubMed
    1. Arstila TP, Casrouge A, Baron V, Even J, Kanellopoulos J, Kourilsky P. A direct estimate of the human alphabeta T cell receptor diversity. Science. 1999;286:958–961. doi: 10.1126/science.286.5441.958. - DOI - PubMed
    1. Rudolph MG, Stanfield RL, Wilson IA. How TCRs bind MHCs, peptides, and coreceptors. Annu Rev Immunol. 2006;24:419–466. doi: 10.1146/annurev.immunol.23.021704.115658. - DOI - PubMed
    1. Moon JJ, Chu HH, Pepper M, McSorley SJ, Jameson SC, Kedl RM, Jenkins MK. Naive CD4(+) T cell frequency varies for different epitopes and predicts repertoire diversity and response magnitude. Immunity. 2007;27:203–213. doi: 10.1016/j.immuni.2007.07.007. - DOI - PMC - PubMed
    1. Wynn KK, Crough T, Campbell S, McNeil K, Galbraith A, Moss DJ, Silins SL, Bell S, Khanna R. Narrowing of T-cell receptor beta variable repertoire during symptomatic herpesvirus infection in transplant patients. Immunol Cell Biol. 2010;88:125–135. doi: 10.1038/icb.2009.74. - DOI - PubMed

Publication types

Substances