Comparative Study
. 2011 Feb 11;88(2):173-82.
doi: 10.1016/j.ajhg.2011.01.010.

A fast, powerful method for detecting identity by descent

Affiliations
Comparative Study

A fast, powerful method for detecting identity by descent

Brian L Browning et al. Am J Hum Genet. .

Abstract

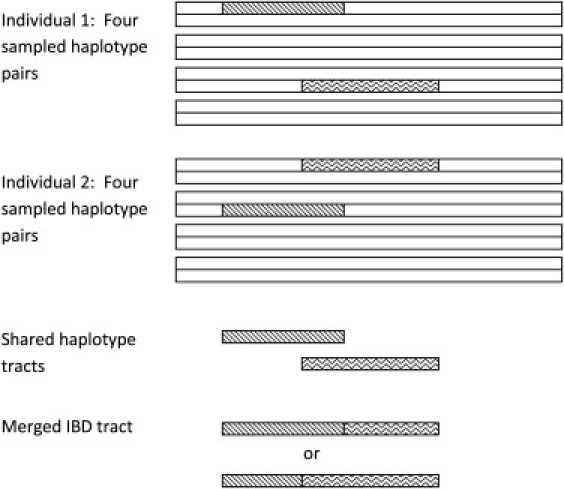
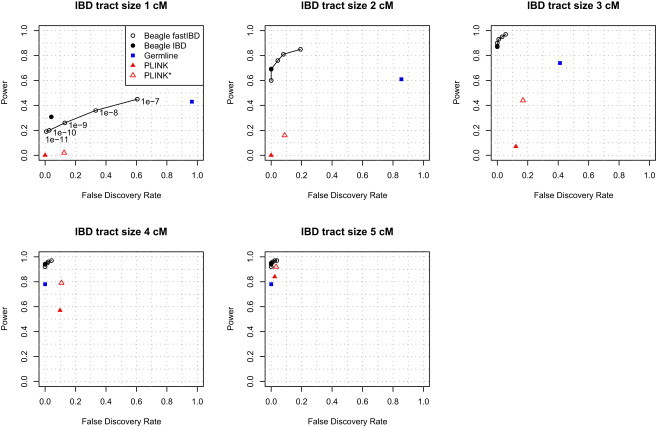
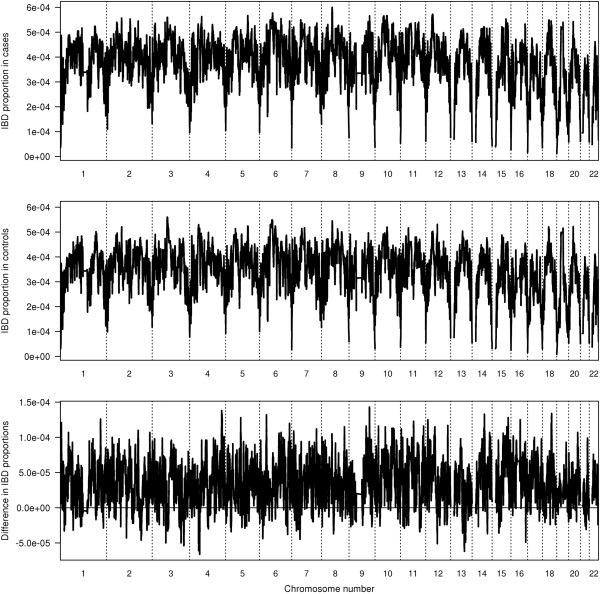
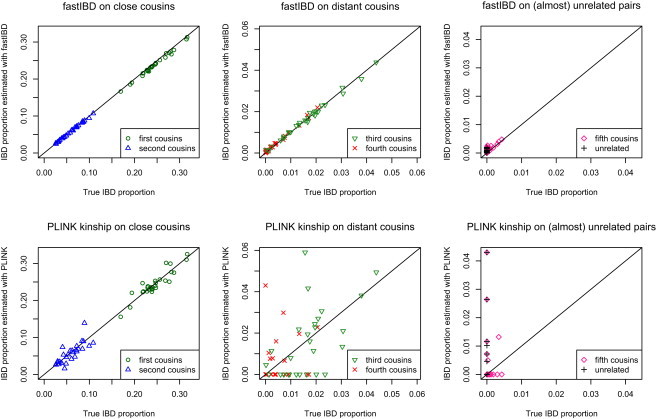
We present a method, fastIBD, for finding tracts of identity by descent (IBD) between pairs of individuals. FastIBD can be applied to thousands of samples across genome-wide SNP data and is significantly more powerful for finding short tracts of IBD than existing methods for finding IBD tracts in such data. We show that fastIBD can detect facets of population structure that are not revealed by other methods. In the Wellcome Trust Case Control Consortium bipolar disorder case-control data, we find a genome-wide excess of IBD in case-case pairs of individuals compared to control-control pairs. We show that this excess can be explained by the geographical clustering of cases. We also show that it is possible to use fastIBD to generate highly accurate estimates of genome-wide IBD sharing between pairs of distant relatives. This is useful for estimation of relationship and for adjusting for relatedness in association studies. FastIBD is incorporated in the freely available Beagle software package.


Figures

Figure 1
Figure 1
Merging of Shared Haplotype Tracts Four pairs of haplotypes have been sampled from individuals 1 and 2. Two shared haplotype tracts have been found (denoted by patterned regions). The two tracts are merged into a single shared haplotype tract.
Figure 2
Figure 2
Beagle Distance versus cM Distance Calculated on the Four Genomic Regions Used in the Power Study Data are from the UK 1958 birth cohort and HapMap CEU on Illumina 550K SNPs. Beagle positions are the Beagle distance from the start of the region. CentiMorgan (cM) positions are estimates from HapMap. For each genomic region, the correlation between the two measures (r) and the slope of the least-squares regression line fit to the data (slope) are given.
Figure 3
Figure 3
False Discovery Rate versus Power Results for the fastIBD method at five values of score threshold and for Beagle IBD, germline, and PLINK with default and relaxed settings for five sizes of IBD tract. Results for PLINK with relaxed settings are denoted by PLINK.
Figure 4
Figure 4
False-Discovery Rate versus Power for the FastIBD Method: Combined Results from Different Numbers of Runs The results from ten runs are the same as those in Figure 2. “Threshold” is the score threshold applied to the fastIBD scores.
Figure 5
Figure 5
FastIBD Average Proportions of Case-Case IBD Sharing and Control-Control IBD Sharing along the Genome for WTCCC Bipolar Case-Control Data The IBD proportion in cases (y axis on top panel) is the fraction of pairs, computed from all case-case pairs, that are estimated to be identical by descent at a given location in the genome. Similarly, the IBD proportion in controls (y axis in middle panel) is computed from all control-control pairs. The difference in IBD proportions (y axis in lower panel) is the IBD proportion in cases minus IBD proportion in controls. Dashed vertical lines mark chromosome boundaries (chromosomes 1–22). The horizontal line in the lowest panel is the difference = 0 line (i.e., IBD proportion in cases = IBD proportion in controls), for comparison.
Figure 6
Figure 6
IBD Proportions Estimated against Constructed “true” IBD Proportions for Five Degrees of Cousins and Unrelated Pairs of Individuals via FastIBD and PLINK Kinship Coefficients IBD proportion is the proportion of the genome containing an IBD tract, or twice the kinship coefficient.

References

    1. Kruglyak L., Daly M.J., Reeve-Daly M.P., Lander E.S. Parametric and nonparametric linkage analysis: a unified multipoint approach. Am. J. Hum. Genet. 1996;58:1347–1363. - PMC - PubMed
    1. Abecasis G.R., Cherney S.S., Cookson W.O., Cardon L.R. Merlin—rapid analysis of dense genetic maps using sparse gene flow trees. Nature Genetics. 2001;30:97–101. - PubMed
    1. Browning S.R., Browning B.L. High-resolution detection of identity by descent in unrelated individuals. Am. J. Hum. Genet. 2010;86:526–539. - PMC - PubMed
    1. Purcell S., Neale B., Todd-Brown K., Thomas L., Ferreira M.A.R., Bender D., Maller J., Sklar P., de Bakker P.I.W., Daly M.J., Sham P.C. PLINK: A tool set for whole-genome association and population-based linkage analyses. Am. J. Hum. Genet. 2007;81:559–575. - PMC - PubMed
    1. Gusev A., Lowe J.K., Stoffel M., Daly M.J., Altshuler D., Breslow J.L., Friedman J.M., Pe'er I. Whole population, genome-wide mapping of hidden relatedness. Genome Res. 2009;19:318–326. - PMC - PubMed

Publication types