

Prognostic value of an RNA expression signature derived from cell cycle proliferation genes in patients with prostate cancer: a retrospective study
- PMID: 21310658
- PMCID: PMC3091030
- DOI: 10.1016/S1470-2045(10)70295-3
Prognostic value of an RNA expression signature derived from cell cycle proliferation genes in patients with prostate cancer: a retrospective study
Abstract
Background: Optimum management of clinically localised prostate cancer presents unique challenges because of the highly variable and often indolent natural history of the disease. To predict disease aggressiveness, clinicians combine clinical variables to create prognostic models, but the models have limited accuracy. We assessed the prognostic value of a predefined cell cycle progression (CCP) score in two cohorts of patients with prostate cancer.
Methods: We measured the expression of 31 genes involved in CCP with quantitative RT-PCR on RNA extracted from formalin-fixed paraffin-embedded tumour samples, and created a predefined score and assessed its usefulness in the prediction of disease outcome. The signature was assessed retrospectively in a cohort of patients from the USA who had undergone radical prostatectomy, and in a cohort of randomly selected men with clinically localised prostate cancer diagnosed by use of a transurethral resection of the prostate (TURP) in the UK who were managed conservatively. The primary endpoint was time to biochemical recurrence for the cohort of patients who had radical prostatectomy, and time to death from prostate cancer for the TURP cohort.
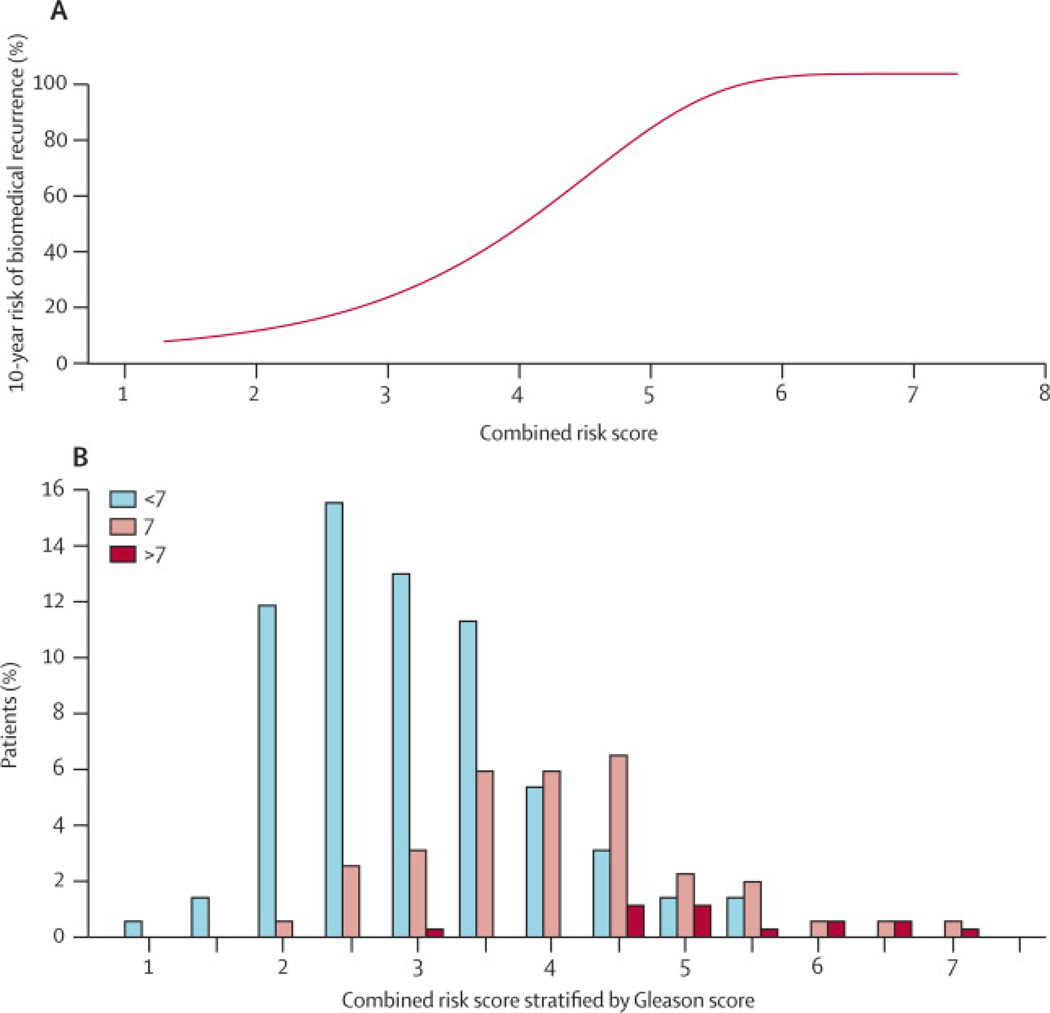
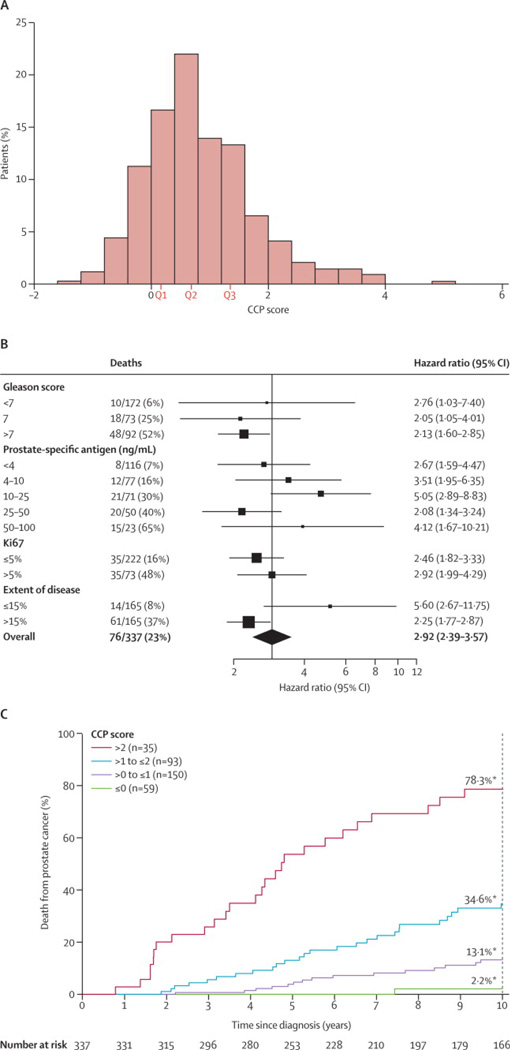
Findings: After prostatectomy, the CCP score was useful for predicting biochemical recurrence in the univariate analysis (hazard ratio for a 1-unit change [doubling] in CCP 1·89; 95% CI 1·54-2·31; p=5·6×10(-9)) and the best multivariate analysis (1·77, 1·40-2·22; p=4·3×10(-6)). In the best predictive model (final multivariate analysis), the CCP score and prostate-specific antigen (PSA) concentration were the most important variables and were more significant than any other clinical variable. In the TURP cohort, the CCP score was the most important variable for prediction of time to death from prostate cancer in both univariate analysis (2·92, 2·38-3·57, p=6·1×10(-22)) and the final multivariate analysis (2·57, 1·93-3·43; p=8·2×10(-11)), and was stronger than all other prognostic factors, although PSA concentration also added useful information. Heterogeneity in the hazard ratio for the CCP score was not noted in any case for any clinical variables.
Interpretation: The results of this study provide strong evidence that the CCP score is a robust prognostic marker, which, after additional validation, could have an essential role in determining the appropriate treatment for patients with prostate cancer.
Funding: Cancer Research UK, Queen Mary University of London, Orchid Appeal, US National Institutes of Health, and Koch Foundation.
Copyright © 2011 Elsevier Ltd. All rights reserved.
Figures


Comment in
-
Show us a sign: the search for "game changing" prostate cancer biomarkers.Lancet Oncol. 2011 Mar;12(3):204-6. doi: 10.1016/S1470-2045(11)70003-1. Lancet Oncol. 2011. PMID: 21310657 No abstract available.
-
Genetics: predictor for prostate cancer.Nat Rev Clin Oncol. 2011 Mar 8;8(4):193. doi: 10.1038/nrclinonc.2011.29. Nat Rev Clin Oncol. 2011. PMID: 21451494 No abstract available.
References
-
- Jemal A, Siegel R, Ward E, Hao Y, Xu J, Murray T, Thun MJ. Cancer statistics, 2009. CA Cancer J Clin. 2009;59:225–249. - PubMed
-
- Evans HS, Moller H. Recent trends in prostate cancer incidence and mortality in southeast England. Eur Urol. 2003;43(4):337–341. - PubMed
-
- Schroder FH, Hugosson J, Roobol MJ, Tammela TL, Ciatto S, Nelen V, et al. Screening and prostate-cancer mortality in a randomized European study. N Engl J Med. 2009;360(13):1320–1328. - PubMed
-
- Breslow N, Chan CW, Dhom G, Drury RA, Franks LM, Gellei B, et al. Latent carcinoma of prostate at autopsy in seven areas. The International Agency for Research on Cancer, Lyons, France. Int J Cancer. 1977;20(5):680–688. - PubMed
-
- Sakr WA, Grignon DJ, Crissman JD, Heilbrun LK, Cassin BJ, Pontes JJ, et al. High grade prostatic intraepithelial neoplasia (HGPIN) and prostatic adenocarcinoma between the ages of 20–69: an autopsy study of 249 cases. In Vivo. 1994;8(3):439–443. - PubMed
Publication types
MeSH terms
Substances
Grants and funding
LinkOut - more resources
Full Text Sources
Other Literature Sources
Medical
Research Materials
Miscellaneous
