. 2011 May;18(5):745-53.
doi: 10.1038/cdd.2011.9. Epub 2011 Feb 11.

Genomic instability in induced stem cells

Affiliations

Genomic instability in induced stem cells

C E Pasi et al. Cell Death Differ. 2011 May.

Abstract

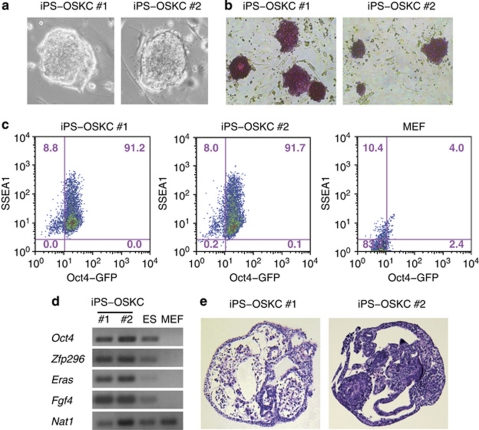
The ability to reprogram adult cells into stem cells has raised hopes for novel therapies for many human diseases. Typical stem cell reprogramming protocols involve expression of a small number of genes in differentiated somatic cells with the c-Myc and Klf4 proto-oncogenes typically included in this mix. We have previously shown that expression of oncogenes leads to DNA replication stress and genomic instability, explaining the high frequency of p53 mutations in human cancers. Consequently, we wondered whether stem cell reprogramming also leads to genomic instability. To test this hypothesis, we examined stem cells induced by a variety of protocols. The first protocol, developed specifically for this study, reprogrammed primary mouse mammary cells into mammary stem cells by expressing c-Myc. Two other previously established protocols reprogrammed mouse embryo fibroblasts into induced pluripotent stem cells by expressing either three genes, Oct4, Sox2 and Klf4, or four genes, OSK plus c-Myc. Comparative genomic hybridization analysis of stem cells derived by these protocols revealed the presence of genomic deletions and amplifications, whose signature was suggestive of oncogene-induced DNA replication stress. The genomic aberrations were to a significant degree dependent on c-Myc expression and their presence could explain why p53 inactivation facilitates stem cell reprogramming.


Figures

Figure 1
Figure 1
Reprogramming of progenitor mammary cells to stem cells by MycER. (a and b) PKH26-negative cells, which are devoid of stem cells, were isolated from secondary mammospheres and infected with a lentivirus-expressing MycER or with a control virus (Empty Vector). The cells were cultured under non-adherent conditions and mammosphere number (a) and cumulative cell number (b) were determined at each passage. Results are presented as means±1 S.D. (c) Representative images of the cultures at passages 1 and 2. (d) Repopulation of a cleared mouse fat pad by MycER-expressing mammospheres originally prepared from PKH26-negative cells with no evidence of tumor development
Figure 2
Figure 2
Stem cell reprogramming of primary mammary cells by MycER. (a) Primary mammary cells prepared from wild-type or p53−/− mice were infected with a lentivirus-expressing MycER or with a control virus (Empty Vector) and cultured under non-adherent conditions. In some cultures TAM was added to induce high levels of MycER activity. The number of mammospheres and the cumulative number of cells were determined at each passage. Results are presented as means±1 S.D. (b) Repopulation of a cleared mouse fat pad by MycER-expressing mammospheres prepared by lentiviral infection of primary mammary cells. There are no signs of tumor development in the replanted mammary gland
Figure 3
Figure 3
Genomic instability in MycER-induced mammary stem cells. (a) Protocol for isolation of genomic DNA from wild-type mammary cells and from MycER-reprogrammed stem cell clones. (b) cGH analysis of four MycER-reprogrammed stem cell clones. Selected regions of mouse chromosomes 9, 13 and 14 are indicated. The results are expressed as log2 ratios of the intensity signals of the stem cell clone DNA to the control DNA. Each black bar represents the average of 10 probes with 1388-bp median spacing. The red lines represent the statistical average and show discontinuities, when a series of averaged probe data deviates in a statistically significant manner from its neighbors. Transcripts are indicated by blue lines and the names of select genes are indicated
Figure 4
Figure 4
Genomic instability in iPS cells induced by OSK. (a) Protocol for isolation of genomic DNA from iPS cells and from non-infected MEFs. (b) cGH analysis of six iPS cell clones. Two regions of mouse chromosome 8 are indicated. The results are expressed as log2 ratios of the intensity signals of the iPS cell DNA to the control DNA. Each black bar represents a single probe with 1388-bp median spacing. The red lines represent the statistical average and show discontinuities, when a series of averaged probe data deviates in a statistically significant manner from its neighbors. Transcripts are indicated by blue lines and the names of select genes are indicated
Figure 5
Figure 5
Characterization of iPS cells induced by four factors (OSKC). (a) Morphology of iPS-OSKC clones 1 and 2 by phase-contrast microscopy. (b) Staining of iPS-OSKC clones 1 and 2 for alkaline phosphatase activity. (c) Expression of pluripotency markers in iPS-OSKC cells. Expression levels of SSEA-1 and Oct4-GFP in iPS-OSK clone 1 and 2 cells and in the MEFs from which these iPS cells were derived, as determined by flow cytometry. The percentages of cells expressing high or low levels of SSEA-1 and Oct4-GFP are indicated by purple-colored numbers. (d) Expression of pluripotency genes in iPS-OSKC cells. Levels of Oct4, Zfp296, Eras and Fgf4 in iPS-OSKC clones 1 and 2, in embryonic stem (ES) cells and in MEFs were determined by PCR. Nat1 expression serves as a standard. (e) Morphology of embryoid bodies formed after differentiation of iPS-OSKC clones 1 and 2 for 7 days in vitro, as revealed by hematoxylin–eosin staining
Figure 6
Figure 6
Genomic instability in iPS cells induced by OSKC. (a) Protocol for isolation of genomic DNA from iPS cells and from non-infected MEFs. (b) cGH analysis of two iPS cell clones. The array hybridization for clone 1 was performed twice and both replicates are shown. Selected regions of mouse chromosomes 7 and 8 are indicated. The results are expressed as log2 ratios of the intensity signals of the iPS cell DNA to the control DNA. Each black bar represents the average of 10 probes with 1388-bp median spacing. The red lines represent the statistical average and show discontinuities, when a series of averaged probe data deviates in a statistically significant manner from its neighbors. Transcripts are indicated by blue lines and the names of select genes are indicated
Figure 7
Figure 7
Genomic instability induced by chronic DNA replication stress. (a) Protocol for isolation of genomic DNA from aphidicolin-treated GM11713A cells and untreated cells. (b) cGH analysis of six aphidicolin-treated clones. Selected regions of human chromosome 3 are indicated. The results are expressed as log2 ratios of the intensity signals of the aphidicolin-treated cell DNA to the control DNA. Each black bar represents the average of 10 probes with 475-bp median spacing. The red lines represent the statistical average and show discontinuities, when a series of averaged probe data deviates in a statistically significant manner from its neighbors. Transcripts are indicated by blue lines and the names of select genes are indicated. The fifth and six clones are related to each other and are referred to as subclones 5a and 5b. (c) List of the 17 largest genes of human chromosome 3, according to their size, indicating also the presence of identified genomic aberrations in the five aphidicolin-treated clones. The status column indicates the number of clones with a genomic aberration and the type of aberration. del, deletion

References

    1. Takahashi K, Yamanaka S. Induction of pluripotent stem cells from mouse embryonic and adult fibroblast cultures by defined factors. Cell. 2006;126:663–676. - PubMed
    1. Okita K, Ichisaka T, Yamanaka S. Generation of germline-competent induced pluripotent stem cells. Nature. 2007;448:313–317. - PubMed
    1. Wernig M, Meissner A, Foreman R, Brambrink T, Ku M, Hochedlinger K, et al. In vitro reprogramming of fibroblasts into a pluripotent ES-cell-like state. Nature. 2007;448:318–324. - PubMed
    1. Wernig M, Meissner A, Cassady JP, Jaenisch R. c-Myc is dispensable for direct reprogramming of mouse fibroblasts. Cell Stem Cell. 2008;2:10–12. - PubMed
    1. Nakagawa M, Koyanagi M, Tanabe K, Takahashi K, Ichisaka T, Aoi T, et al. Generation of induced pluripotent stem cells without Myc from mouse and human fibroblasts. Nat Biotechnol. 2008;26:101–106. - PubMed

Publication types

MeSH terms