

Wide-Field Multi-Parameter FLIM: long-term minimal invasive observation of proteins in living cells
- PMID: 21311595
- PMCID: PMC3032730
- DOI: 10.1371/journal.pone.0015820
Wide-Field Multi-Parameter FLIM: long-term minimal invasive observation of proteins in living cells
Abstract
Time-domain Fluorescence Lifetime Imaging Microscopy (FLIM) is a remarkable tool to monitor the dynamics of fluorophore-tagged protein domains inside living cells. We propose a Wide-Field Multi-Parameter FLIM method (WFMP-FLIM) aimed to monitor continuously living cells under minimum light intensity at a given illumination energy dose. A powerful data analysis technique applied to the WFMP-FLIM data sets allows to optimize the estimation accuracy of physical parameters at very low fluorescence signal levels approaching the lower bound theoretical limit. We demonstrate the efficiency of WFMP-FLIM by presenting two independent and relevant long-term experiments in cell biology: 1) FRET analysis of simultaneously recorded donor and acceptor fluorescence in living HeLa cells and 2) tracking of mitochondrial transport combined with fluorescence lifetime analysis in neuronal processes.
Conflict of interest statement
Figures

 (black) and expected one by a mono-exponential fit assuming a F-value equal to 1 (red).
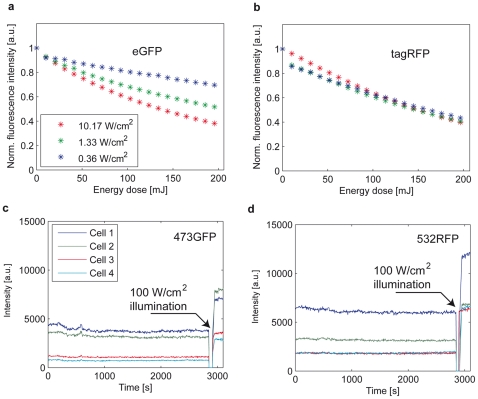
 to monitor the production of ROS species in the 473GFP and (d) 532RFP channels. No increase of the fluorescence due to the illumination-induced oxidation of the
  molecules was observed during 45 minutes. Few seconds of strong illumination by a Hg-lamp (
 for 5 seconds) were sufficient to generate ROS and increase the fluorescence signal. The intensity of the fluorescence signals is given in arbitrary units [a.u.].
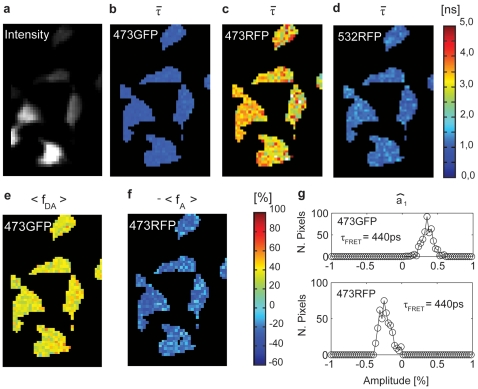
 and (f)
  . (g) Histogram of the parameters
  in the 473GFP and 473RFP channels. In the 473RFP channel the pre-exponential factor assumes negative values.
References
-
- Gadella TWJ, editor. Amsterdam: Elsevier Science; 2008. FRET and FLIM Techniques, Volume 33.
-
- Bastiaens PI, Squire A. Fluorescence lifetime imaging microscopy: spatial resolution of biochemical processes in the cell. Trends Cell Biol. 1999;9:48–52. - PubMed
-
- Jares-Erijman EA, Jovin TM. Imaging molecular interactions in living cells by FRET microscopy. Curr Opin Chem Biol. 2006;10:409–416. - PubMed
-
- O'Connor D, Phillips D. London: Academic Press; 1984. Time-Correlated Single Photon Counting.
-
- Becker W. Springer Series in Chemical Physics; 2005. Advanced Time-Correlated Single Photon Counting Techniques.
Publication types
MeSH terms
Substances
LinkOut - more resources
Full Text Sources
