. 2011 Feb 2;6(2):e16006.
doi: 10.1371/journal.pone.0016006.

Added value measures in education show genetic as well as environmental influence

Affiliations

Added value measures in education show genetic as well as environmental influence

Claire M A Haworth et al. PLoS One. .

Abstract

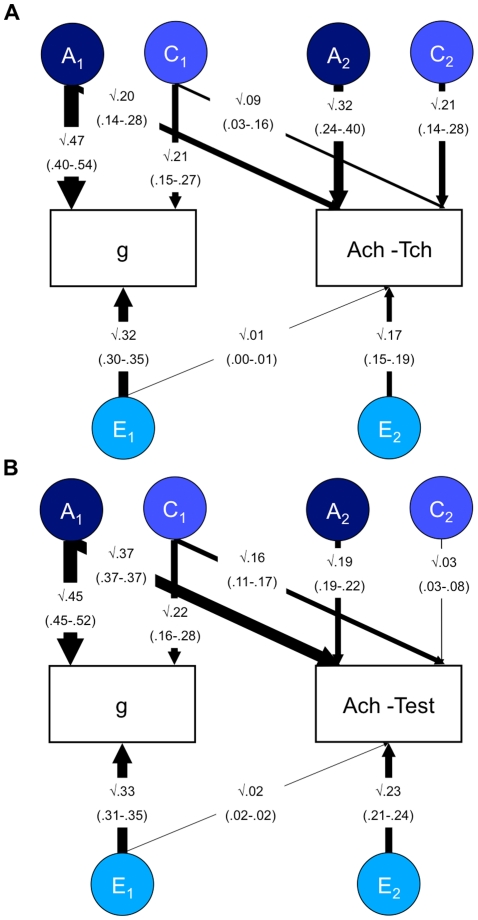
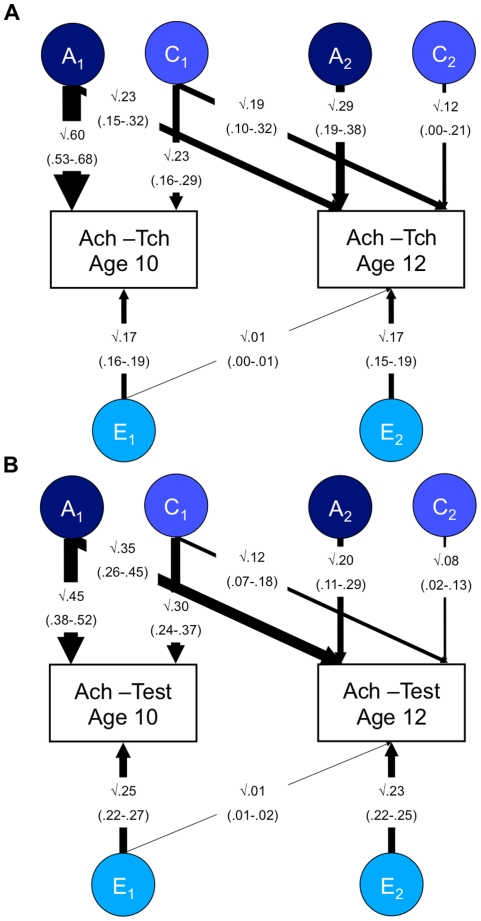
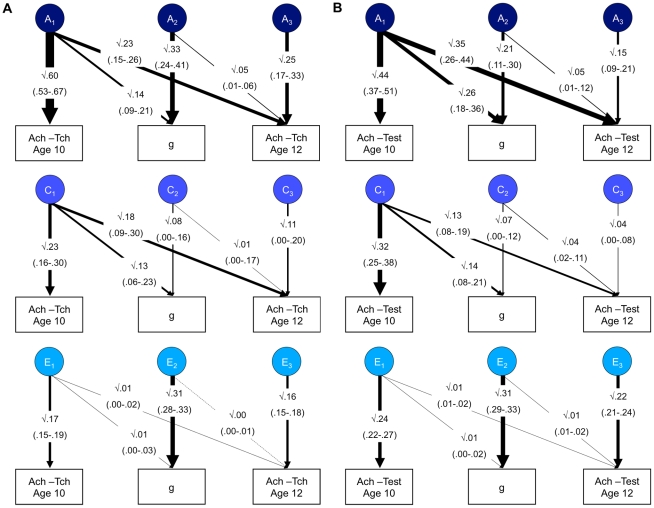
Does achievement independent of ability or previous attainment provide a purer measure of the added value of school? In a study of 4000 pairs of 12-year-old twins in the UK, we measured achievement with year-long teacher assessments as well as tests. Raw achievement shows moderate heritability (about 50%) and modest shared environmental influences (25%). Unexpectedly, we show that for indices of the added value of school, genetic influences remain moderate (around 50%), and the shared (school) environment is less important (about 12%). The pervasiveness of genetic influence in how and how much children learn is compatible with an active view of learning in which children create their own educational experiences in part on the basis of their genetic propensities.


Conflict of interest statement

Competing Interests: The authors have declared that no competing interests exist.

Figures

Figure 1
Figure 1. Bivariate analysis of g and achievement.
Panel A = g and teacher-rated achievement at 12 years. Panel B = g and test achievement at 12 years. g =  general cognitive ability; Ach-Tch  =  Teacher-rated achievement; Ach-Test  =  test achievement; A =  additive genetic; C =  Shared environment; E =  Non-shared environment. The figures represent the results from a standardized Cholesky decomposition of twin data. 95% confidence intervals of the path estimates are shown in parentheses. The first factors assess genetic (A1), shared (C1) and non-shared environmental (E1) influences on g, some of which may also influence school achievement. The second factor estimates influences on achievement that are independent of the influences on g (A2, C2 and E2). Results indicate significant residual genetic influence on school achievement, even when the genetic and environmental co-variance with general cognitive ability has been removed (see the A2 path estimate).
Figure 2
Figure 2. Bivariate analysis of 10 and 12-year achievement.
Panel A =  Teacher-rated achievement at 10 and 12 years. Panel B =  Test achievement at 10 and 12 years. Ach-Tch  =  Teacher-rated achievement; Ach-Test  =  test achievement; A =  additive genetic; C =  Shared environment; E =  Non-shared environment. The figures represent the results from a standardized Cholesky decomposition of twin data. 95% confidence intervals of the path estimates are shown in parentheses. The first factors assess genetic (A1), shared (C1) and non-shared environmental (E1) influences on 10-year achievement, some of which may also influence 12- year school achievement. The second factor estimates influences on 12-year achievement that are independent of the influences on 10-year achievement (A2, C2 and E2). Results indicate significant residual genetic influence on 12-year school achievement, even when the genetic and environmental co-variance with previous achievement has been removed (see the A2 path estimate).
Figure 3
Figure 3. Trivariate analysis of 10-year achievement, general cognitive ability and 12-year achievement.
Panel A =  Teacher-rated achievement. Panel B =  Test achievement. g =  general cognitive ability; Ach-Tch  =  Teacher-rated achievement; Ach-Test  =  test achievement; A =  additive genetic; C =  Shared environment; E =  Non-shared environment. The figures represent the results from a standardized Cholesky decomposition of twin data. 95% confidence intervals of the path estimates are shown in parentheses. The first factors assess genetic (A1), shared (C1) and non-shared environmental (E1) influences on 10-year achievement, some of which may also influence g and 12-year achievement. The second factor estimates influences on 12-year g that are independent of the influences on 10-year achievement, and which may also influence 12-year achievement (A2, C2 and E2). The third factor (A3, C3 and E3) estimates influences on 12-year achievement that are independent of those on 10-year achievement and 12-year g. Results indicate significant residual genetic influence on school achievement, even when the genetic and environmental co-variance with previous achievement and general cognitive ability has been removed (see the A3 path estimates).

References

    1. Machin S, Vignoles A. Report No. Centre for the Economics of Education;; 2006. Education Policy in the UK.57
    1. Raudenbush SW. What are value-added models estimating and what does this imply for statistical practice? J Educ Behav Stat. 2004;29:121–129. doi: 10.3102/10769986029001121. - DOI
    1. Thomas S, Peng WJ, Gray J. Value added trends in English secondary school performance over ten years. Oxford Rev Educ. 2007;33:261–295.
    1. McCaffrey DF, Lockwood JR, Koretz D, Louis TA, Hamilton L. Models for value-added modeling of teacher effects. J Educ Behav Stat. 2004;29:67–101. doi: 10.3102/10769986029001067. - DOI - PMC - PubMed
    1. Boomsma D, Busjahn A, Peltonen L. Classical twin studies and beyond. Nat Rev Genet. 2002;3:872–882. doi: 10.1038/nrg932. - DOI - PubMed

Publication types