Qualification of the analytical and clinical performance of CSF biomarker analyses in ADNI
- PMID: 21311900
- PMCID: PMC3175107
- DOI: 10.1007/s00401-011-0808-0
Qualification of the analytical and clinical performance of CSF biomarker analyses in ADNI
Abstract
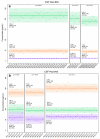
The close correlation between abnormally low pre-mortem cerebrospinal fluid (CSF) concentrations of amyloid-β1-42 (Aβ(1-42)) and plaque burden measured by amyloid imaging as well as between pathologically increased levels of CSF tau and the extent of neurodegeneration measured by MRI has led to growing interest in using these biomarkers to predict the presence of AD plaque and tangle pathology. A challenge for the widespread use of these CSF biomarkers is the high variability in the assays used to measure these analytes which has been ascribed to multiple pre-analytical and analytical test performance factors. To address this challenge, we conducted a seven-center inter-laboratory standardization study for CSF total tau (t-tau), phospho-tau (p-tau(181)) and Aβ(1-42) as part of the Alzheimer's Disease Neuroimaging Initiative (ADNI). Aliquots prepared from five CSF pools assembled from multiple elderly controls (n = 3) and AD patients (n = 2) were the primary test samples analyzed in each of three analytical runs by the participating laboratories using a common batch of research use only immunoassay reagents (INNO-BIA AlzBio3, xMAP technology, from Innogenetics) on the Luminex analytical platform. To account for the combined effects on overall precision of CSF samples (fixed effect), different laboratories and analytical runs (random effects), these data were analyzed by mixed-effects modeling with the following results: within center %CV 95% CI values (mean) of 4.0-6.0% (5.3%) for CSF Aβ(1-42); 6.4-6.8% (6.7%) for t-tau and 5.5-18.0% (10.8%) for p-tau(181) and inter-center %CV 95% CI range of 15.9-19.8% (17.9%) for Aβ(1-42), 9.6-15.2% (13.1%) for t-tau and 11.3-18.2% (14.6%) for p-tau(181). Long-term experience by the ADNI biomarker core laboratory replicated this degree of within-center precision. Diagnostic threshold CSF concentrations for Aβ(1-42) and for the ratio t-tau/Aβ(1-42) were determined in an ADNI independent, autopsy-confirmed AD cohort from whom ante-mortem CSF was obtained, and a clinically defined group of cognitively normal controls (NCs) provides statistically significant separation of those who progressed from MCI to AD in the ADNI study. These data suggest that interrogation of ante-mortem CSF in cognitively impaired individuals to determine levels of t-tau, p-tau(181) and Aβ(1-42), together with MRI and amyloid imaging biomarkers, could replace autopsy confirmation of AD plaque and tangle pathology as the "gold standard" for the diagnosis of definite AD in the near future.
Figures


References
-
- Andreasen N, Hesse C, Davidsson P, et al. Cerebrospinal fluid beta-amyloid(1–42) in Alzheimer disease: differences between early- and late-onset Alzheimer disease and stability during the course of disease. Arch Neurol. 1999;56:673–680. - PubMed
-
- Bates D, Maechler M. lme4: Linear mixed-effects models using S4 classes. R package version 0.999375-34. 2010. http://CRAN.R-project.org/package=lme4.
-
- Buerger K, Ewers M, Pirttila T, et al. CSF phosphorylated tau protein correlates with neocortical neurofibrillary pathology in Alzheimer’s disease. Brain. 2006;129:3035–3041. - PubMed
-
- Buerger K, Frisoni G, Uspenskaya O, et al. Validation of Alzheimer’s disease CSF and plasma biological markers: the multicentre reliability study of the pilot European Alzheimer’s Disease Neuroimaging Initiative (E-ADNI) Exp Gerontol. 2009;44:579–585. - PubMed
Publication types
MeSH terms
Substances
Grants and funding
LinkOut - more resources
Full Text Sources
Medical

