. 2011 May 7;276(1):218-28.
doi: 10.1016/j.jtbi.2011.01.042. Epub 2011 Feb 16.

Slow variable dominance and phase resetting in phantom bursting

Affiliations

Slow variable dominance and phase resetting in phantom bursting

Margaret Watts et al. J Theor Biol. .

Abstract

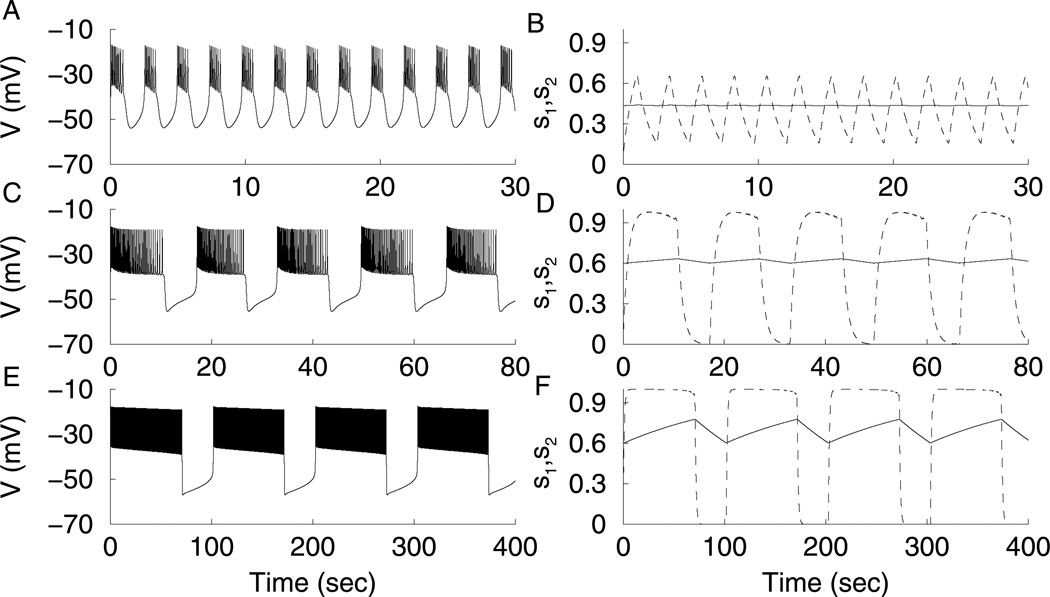
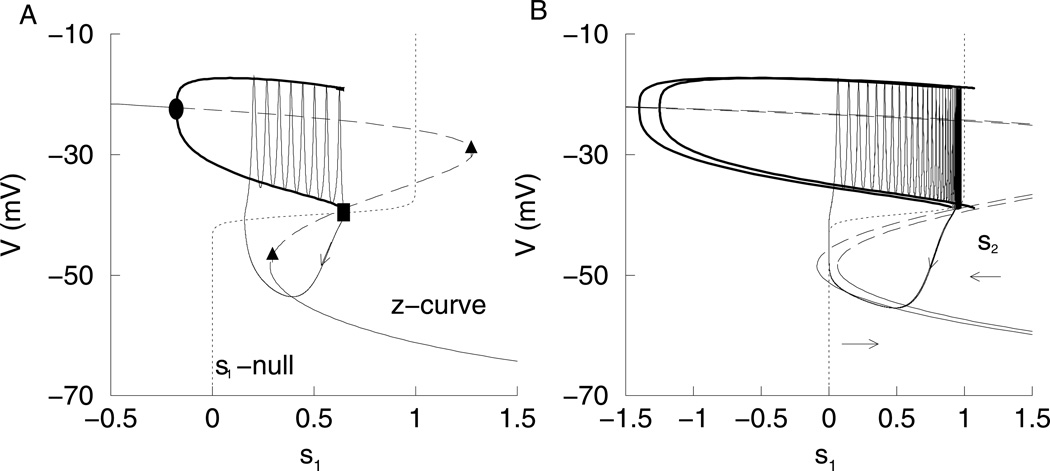
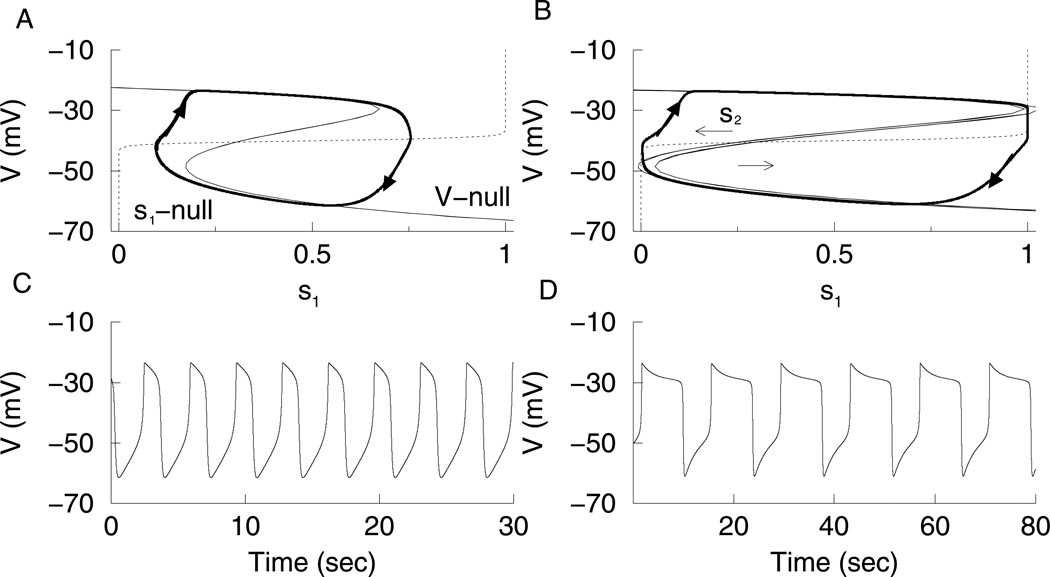
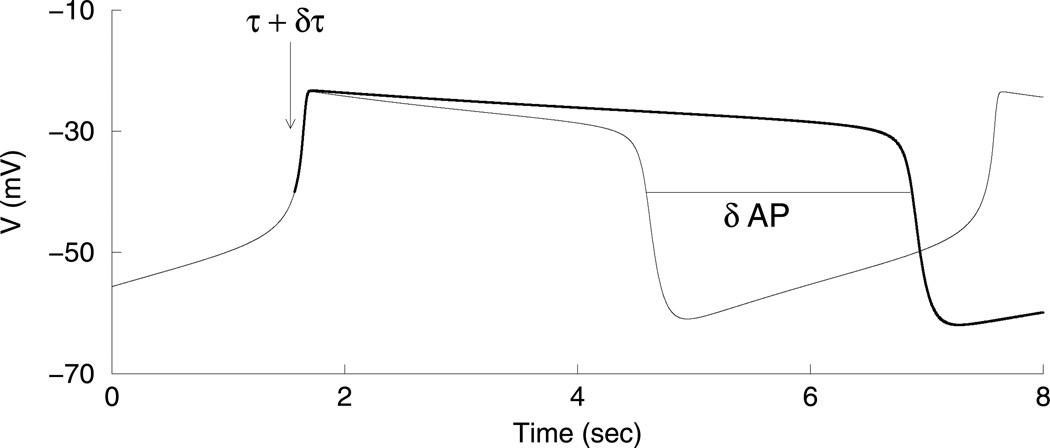
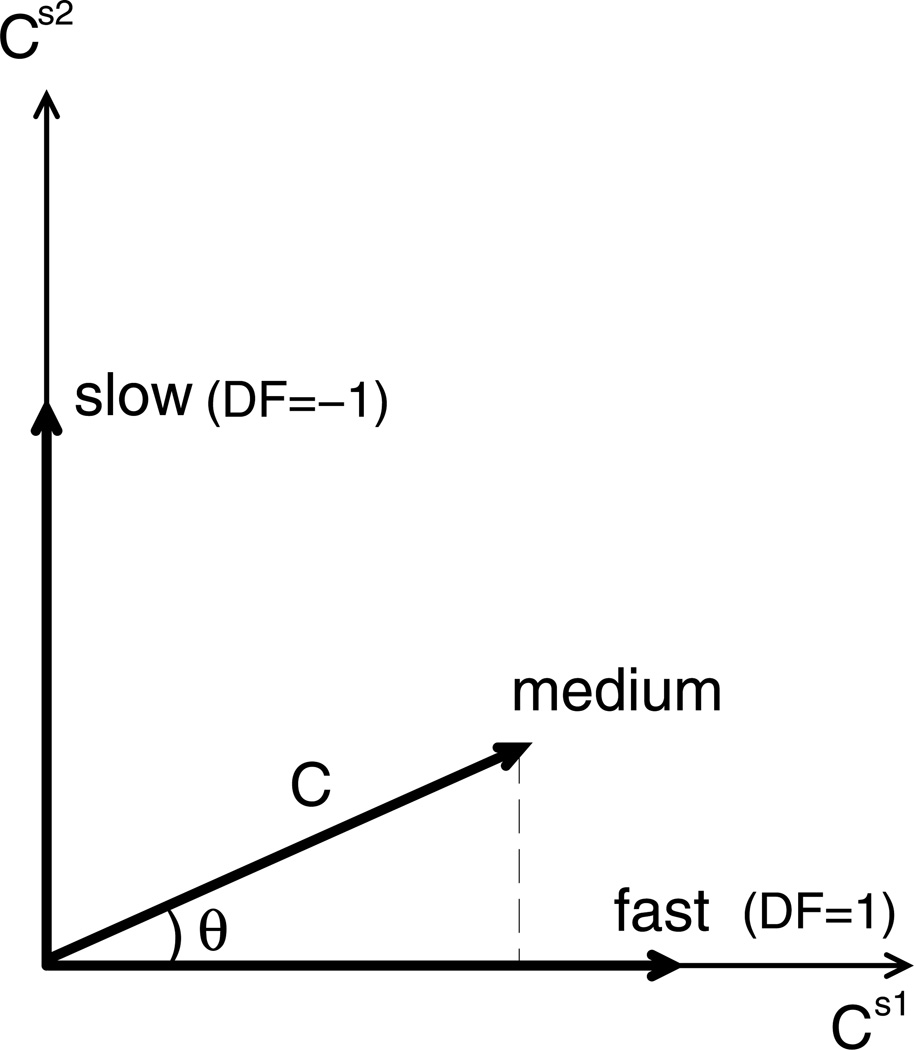
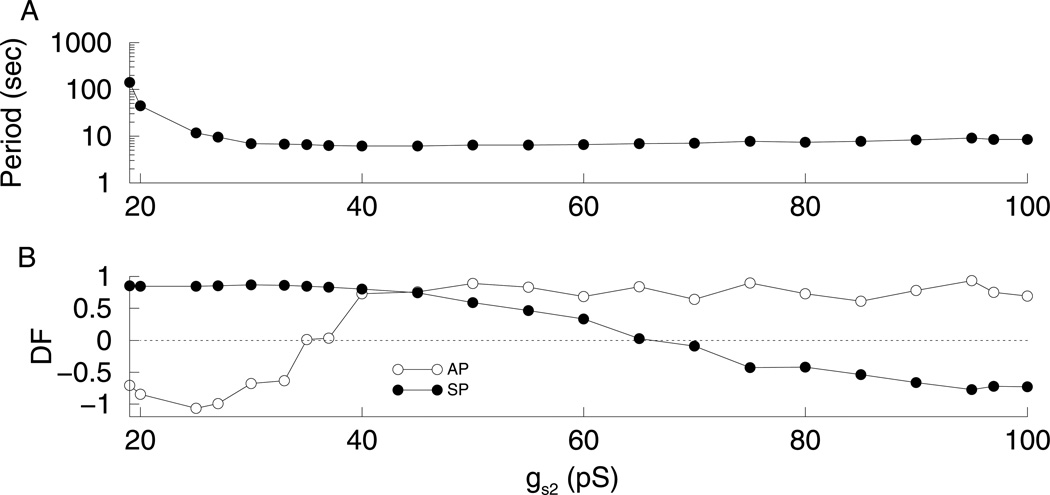
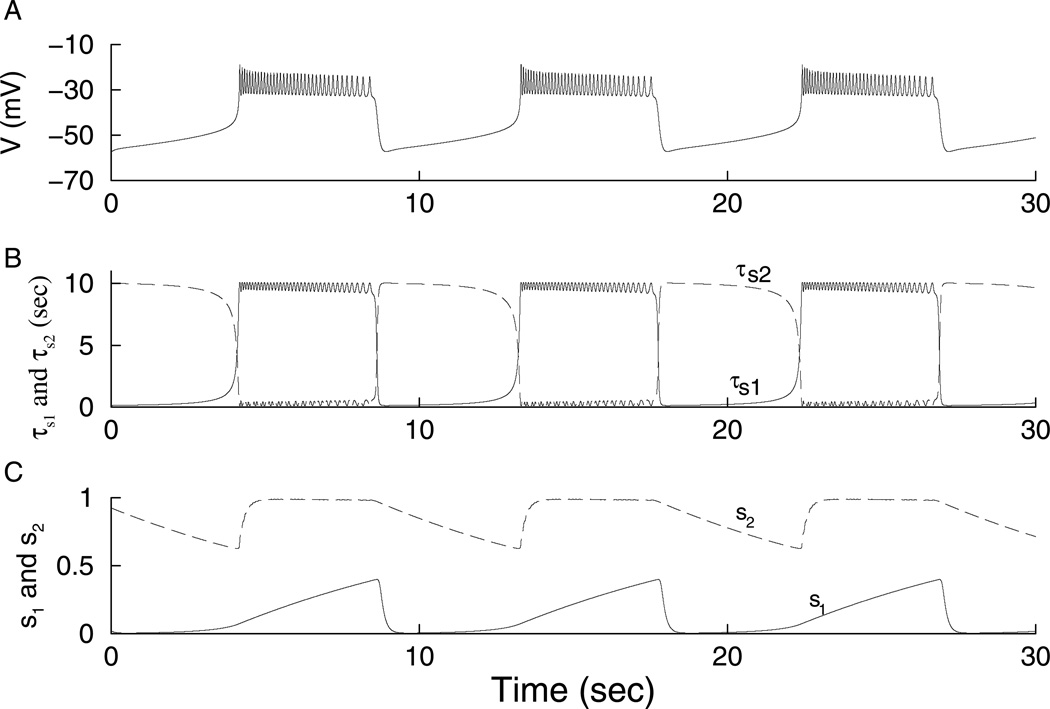
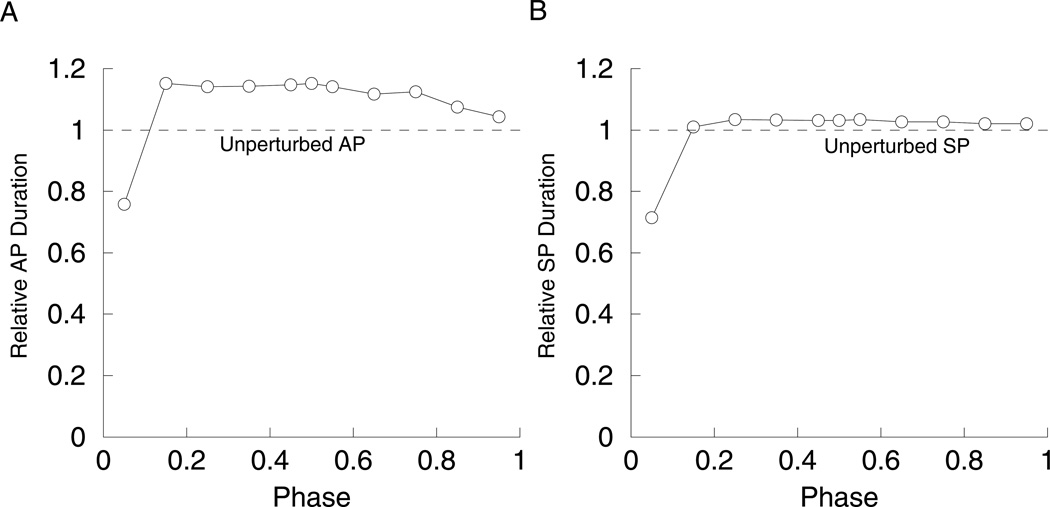
Bursting oscillations are common in neurons and endocrine cells. One type of bursting model with two slow variables has been called 'phantom bursting' since the burst period is a blend of the time constants of the slow variables. A phantom bursting model can produce bursting with a wide range of periods: fast (short period), medium, and slow (long period). We describe a measure, which we call the 'dominance factor', of the relative contributions of the two slow variables to the bursting produced by a simple phantom bursting model. Using this tool, we demonstrate how the control of different phases of the burst can be shifted from one slow variable to another by changing a model parameter. We then show that the dominance curves obtained as a parameter is varied can be useful in making predictions about the resetting properties of the model cells. Finally, we demonstrate two mechanisms by which phase-independent resetting of a burst can be achieved, as has been shown to occur in the electrical activity of pancreatic islets.


Figures

Figure 1
Figure 1
(A) Fast bursting, gs1 = 20 pS. (B) Bursting is driven by s1 (dashed), while s2 is nearly constant (solid). (C,D) Medium bursting driven by both s1 and s2, gs1 = 7 pS. (E, F) Slow bursting, is driven by s2, gs1 = 2 pS.
Figure 2
Figure 2
(A) Fast subsystem bifurcation diagram of fast bursting (gs1 = 20 pS) with s1 as the bifurcation parameter and s2 = 0.436. The s1-nullcline and burst trajectory are superimposed on the bifurcation diagram. The circle represents a Hopf bifurcation, the square represents a homoclinic bifurcation, and the triangles represent saddle node bifurcations. (B) Fast/slow analysis of medium bursting (gs1 = 7 pS). There are two bifurcation diagrams with s1 as the bifurcation parameter. The curve on the left has s2 fixed at its maximum value (0.633) achieved during the bursting, while the curve on the right has s2 fixed at is minimum value (0.600). The burst trajectory is superimposed on the diagram. Arrows indicate direction of movement of the z-curve driven by variations in s2.
Figure 3
Figure 3
Phase plane analysis of fast and medium relaxation oscillations. (A) The V-nullcline (z-shaped curve) and s1-nullcline (dotted curve) for fast oscillations with gs1 = 40 pS and s2 fixed at 0.436. The trajectory (heavy solid curve) follows the upper and lower branches of the V-nullcline. (B) The V-nullcline and s1-nullcline for medium oscillations with gs1 = 20 pS. The V-nullcline on the left has s2 at it maximum value (0.619), while the V-nullcline on the right has s2 at its minimum value (0.591). (C) Fast relaxation oscillations driven by s1. (D) Medium relaxation oscillations driven by s1 and s2.
Figure 4
Figure 4
Measuring the effect of a slow variable on the duration of the active phase. The time constant of the slow variable, τ, is increased by δτ at the beginning of the active phase (arrow). This causes the slow variable to slow down and the active phase duration to increase by δAP (bold curve).
Figure 5
Figure 5
Interpretation of the dominance factor, DF = cosθ−sinθ. When θ = 0, DF = 1 and the oscillation is fast. When θ=π2, DF = −1 and the oscillation is slow. Medium frequency oscillations occur when θ(0,π2) and DF ∈ (−1, 1).
Figure 6
Figure 6
Results of the quantification method on the phantom relaxation oscillator. δτ=τ here and in other figures that follow. The results obtained using δτ = 0.05τ are similar for the relaxation case. (A) Oscillation period decreases with gs1. (B) C values for active and silent phases and for s1 and s2. (C) For low values of gs1 the DF is close to −1 indicating that s2 is the variable driving slow oscillations, while for high values of gs1 DF is close to 1 indicating that s1 is the variable driving slow oscillations.
Figure 7
Figure 7
Results for phantom bursting. (A) Burst period decreases with gs1. (B) C values for active and silent phases and for s1 and s2. (C) For low values of gs1, DF is close to −1 indicating that s2 is the variable driving slow bursting, while for high values of gs1, DF is close to 1 indicating that s1 is the variable driving fast bursting. The type of bursting can be defined in terms of the dominance factors.
Figure 8
Figure 8
As s1 rises during an active phase, Is1 increases, which promotes the termination of the AP. However, Is1 starts to decline toward the end of the burst, leading to burst prolongation. Therefore, an increase in the time constant for s2s2), leads to a longer decline in s1 (bold part of curve), which acts to increase AP duration.
Figure 9
Figure 9
Results for phantom bursting with gs2 as the varying parameter and gs1 = 8.5 pS. (A) Burst period decreases with gs2. For gs2 < 19 pS, the system spikes continuously. (B) C values for active and silent phases and for s1 and s2. (C) For low values of gs2, DFAP is close to −1 and DFSP is close to 1 indicating that s2 drives the active phase, while s1 drives the silent phase. However, for high values of gs2 DFAP is close to 1 and DFSP is close to −1 indicating that s1 drives the AP, while s2 drives the SP.
Figure 10
Figure 10
Bifurcation diagrams with gs1 = 8.5 pS. The two dashed curves are the bifurcation diagrams for the extreme values of s2. (A)For gs2 = 100 pS, the phase point gets stuck in the SP. (B)For gs2 = 40 pS, the phase point does not get stuck. (C)For gs2 = 20 pS, the phase point gets stuck in the AP.
Figure 11
Figure 11
Resetting with gs2 = 27 pS and gs1 = 8.5 pS. In this case, s1 is in control of the SP (DF = 0.85), while s2 is in control of the AP (DF = −0.99). (A) Half-way through the AP the system was reset to the SP (arrow), which has full length. s1 has reached its maximum at the time of resetting (bottom curve). The V and s1 time courses have been scaled to facilitate comparison. (B) Half-way through the SP the system was reset to the AP (arrow), which is reduced. s2 is in the middle of decreasing to its minimum value at the time of resetting (bottom curve). (C) The duration of the induced AP is phase dependent. (D) The duration of the induced SP is close to the duration of the unperturbed SP if the resetting occurs after s1 reaches its maximum value.
Figure 12
Figure 12
Resetting with gs2 = 97 pS and gs1 = 8.5 pS. In this case, s1 is in control of the AP (DF = 0.79), while s2 is in control of the SP (DF = −0.68). (A) Half-way through the AP the system was reset to the SP (arrow), which is reduced. s2 is midway to its maximum value at the time of resetting (bottom curve). (B) Half-way through the SP the system was reset to the AP (arrow), which has full length. s1 has reached its minimum value at the time of reseting (bottom curve). (C) The duration of the induced AP is close to the width of the unperturbed AP if the resetting occurs after s1 reaches its minimum value. (D) The width of the induced SP is phase dependent.
Figure 13
Figure 13
Bursting produced by the model with V-dependent s1 and s2 time scales (Eqs. 18, 19), gs1 = 16 pS and gs2 = 30 pS. (A) Voltage time course. (B) τs1 ≈ 10 sec during the active phase and ≈ 100 msec during the silent phase. s1 is in control of the active phase. (C) τs2 ≈ 100 msec during the active phase and ≈ 10 sec during the silent phase. s2 is in control of the silent phase.
Figure 14
Figure 14
Bidirectional resetting produced by the bursting model with V-dependent s1 and s2 time scales, gs1 = 16 pS, and gs2 = 30 pS. (A) Silent-active phase-independent resetting. (B) Active-silent phase-independent resetting.

References

    1. Bertram R, Previte J, Sherman A, Kinard T, Satin L. The phantom burster model for pancreatic β-cells. Biophys. J. 2000;79:2880–2892. - PMC - PubMed
    1. Bertram R, Sherman A. Dynamical complexity and temporal plasticity in pancreatic β-cells. J. Bio. Sci. 2000;25:197–209. - PubMed
    1. Bertram R, Sherman A. A calcium-based phantom bursting model for pancreatic islets. Bull. Math. Biol. 2004;66:1313–1344. - PubMed
    1. Bertram R, Sherman A. Negative calcium feedback: The road from Chay-Keizer. In: Coombes S, Bressloff P, editors. The Genesis of Rhythm in the Nervous System. New Jersey: World Scientific Press; 2005. pp. 19–48.
    1. Butera R, Rinzel J, Smith J. Models of repiratory rhythm generation in the pre-Bötzinger complex. I. Bursting pacemaker neurons. J. Neurophysiol. 1999;80:382–397. - PubMed

Publication types

LinkOut - more resources