LoAd: a locally adaptive cortical segmentation algorithm
- PMID: 21316470
- PMCID: PMC3554791
- DOI: 10.1016/j.neuroimage.2011.02.013
LoAd: a locally adaptive cortical segmentation algorithm
Abstract
Thickness measurements of the cerebral cortex can aid diagnosis and provide valuable information about the temporal evolution of diseases such as Alzheimer's, Huntington's, and schizophrenia. Methods that measure the thickness of the cerebral cortex from in-vivo magnetic resonance (MR) images rely on an accurate segmentation of the MR data. However, segmenting the cortex in a robust and accurate way still poses a challenge due to the presence of noise, intensity non-uniformity, partial volume effects, the limited resolution of MRI and the highly convoluted shape of the cortical folds. Beginning with a well-established probabilistic segmentation model with anatomical tissue priors, we propose three post-processing refinements: a novel modification of the prior information to reduce segmentation bias; introduction of explicit partial volume classes; and a locally varying MRF-based model for enhancement of sulci and gyri. Experiments performed on a new digital phantom, on BrainWeb data and on data from the Alzheimer's Disease Neuroimaging Initiative (ADNI) show statistically significant improvements in Dice scores and PV estimation (p<10(-3)) and also increased thickness estimation accuracy when compared to three well established techniques.
Copyright © 2011 Elsevier Inc. All rights reserved.
Figures


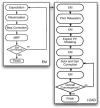
 (hCSF, sWM) and
 (hWM, sCSF) on the top and bottom respectively; (right)
and
in green and red respectively.


Similar articles
-
Improved maximum a posteriori cortical segmentation by iterative relaxation of priors.Med Image Comput Comput Assist Interv. 2009;12(Pt 2):441-9. doi: 10.1007/978-3-642-04271-3_54. Med Image Comput Comput Assist Interv. 2009. PMID: 20426142
-
A learning-based wrapper method to correct systematic errors in automatic image segmentation: consistently improved performance in hippocampus, cortex and brain segmentation.Neuroimage. 2011 Apr 1;55(3):968-85. doi: 10.1016/j.neuroimage.2011.01.006. Epub 2011 Jan 13. Neuroimage. 2011. PMID: 21237273 Free PMC article.
-
Unifying framework for multimodal brain MRI segmentation based on Hidden Markov Chains.Med Image Anal. 2008 Dec;12(6):639-52. doi: 10.1016/j.media.2008.03.001. Epub 2008 Mar 17. Med Image Anal. 2008. PMID: 18440268
-
Robust generative asymmetric GMM for brain MR image segmentation.Comput Methods Programs Biomed. 2017 Nov;151:123-138. doi: 10.1016/j.cmpb.2017.08.017. Epub 2017 Aug 24. Comput Methods Programs Biomed. 2017. PMID: 28946994
-
Automatic delineation of sulci and improved partial volume classification for accurate 3D voxel-based cortical thickness estimation from MR.Med Image Comput Comput Assist Interv. 2008;11(Pt 1):253-61. doi: 10.1007/978-3-540-85988-8_31. Med Image Comput Comput Assist Interv. 2008. PMID: 18979755
Cited by
-
Fully-Automated μMRI Morphometric Phenotyping of the Tc1 Mouse Model of Down Syndrome.PLoS One. 2016 Sep 22;11(9):e0162974. doi: 10.1371/journal.pone.0162974. eCollection 2016. PLoS One. 2016. PMID: 27658297 Free PMC article.
-
A novel cortical thickness estimation method based on volumetric Laplace-Beltrami operator and heat kernel.Med Image Anal. 2015 May;22(1):1-20. doi: 10.1016/j.media.2015.01.005. Epub 2015 Feb 3. Med Image Anal. 2015. PMID: 25700360 Free PMC article.
-
Thalamic volumetric abnormalities in type 1 diabetes mellitus and 'peripheral' neuropathy.Sci Rep. 2022 Jul 29;12(1):13053. doi: 10.1038/s41598-022-16699-x. Sci Rep. 2022. PMID: 35906253 Free PMC article.
-
The NifTK software platform for image-guided interventions: platform overview and NiftyLink messaging.Int J Comput Assist Radiol Surg. 2015 Mar;10(3):301-16. doi: 10.1007/s11548-014-1124-7. Epub 2014 Nov 20. Int J Comput Assist Radiol Surg. 2015. PMID: 25408304 Free PMC article.
-
Accurate multimodal probabilistic prediction of conversion to Alzheimer's disease in patients with mild cognitive impairment.Neuroimage Clin. 2013 May 19;2:735-45. doi: 10.1016/j.nicl.2013.05.004. eCollection 2013. Neuroimage Clin. 2013. PMID: 24179825 Free PMC article.
References
-
- Acosta O, Bourgeat P, Fripp J, Bonner E, Ourselin S, Salvado O. Automatic delineation of sulci and improved partial volume classification for accurate 3D voxel-based cortical thickness estimation from MR. Lecture Notes in Computer Science — MICCAI. 2008:253–261. - PubMed
-
- Ashburner J, Friston KJ. Unified segmentation. Neuroimage. 2005 Jan;26(3):839–851. - PubMed
-
- Ashburner J, Friston KJ. Computing average shaped tissue probability templates. Neuroimage. 2009 Jan;45(2):333–341. - PubMed
-
- Aubert-Broche B, Griffin M, Pike GB, Evans AC, Collins DL. Twenty new digital brain phantoms for creation of validation image data bases. IEEE Trans Med Imaging. 2006 Nov;25(11):1410–1416. - PubMed
Publication types
MeSH terms
Grants and funding
LinkOut - more resources
Full Text Sources
Miscellaneous

