

In vitro and preliminary in vivo validation of echo particle image velocimetry in carotid vascular imaging
- PMID: 21316562
- PMCID: PMC3449315
- DOI: 10.1016/j.ultrasmedbio.2010.11.017
In vitro and preliminary in vivo validation of echo particle image velocimetry in carotid vascular imaging
Abstract
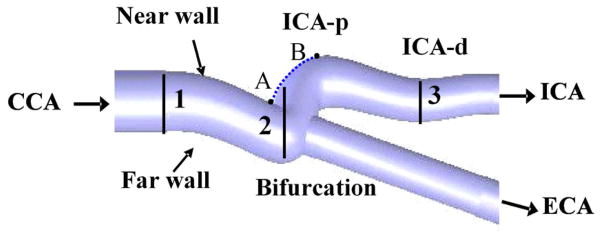
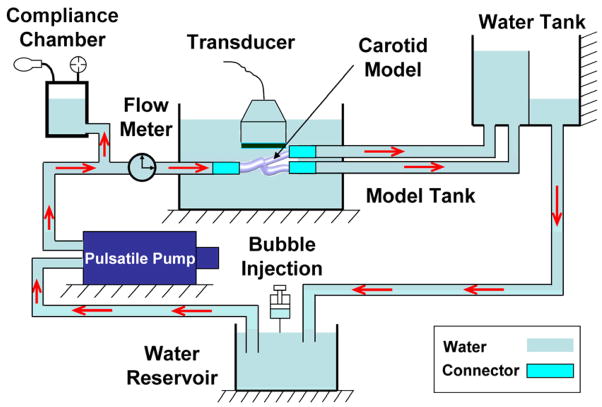
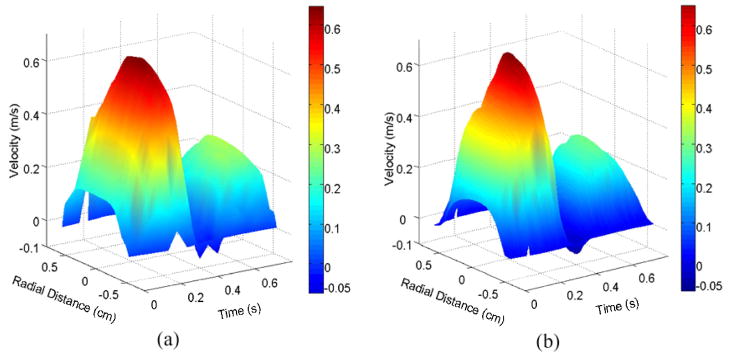
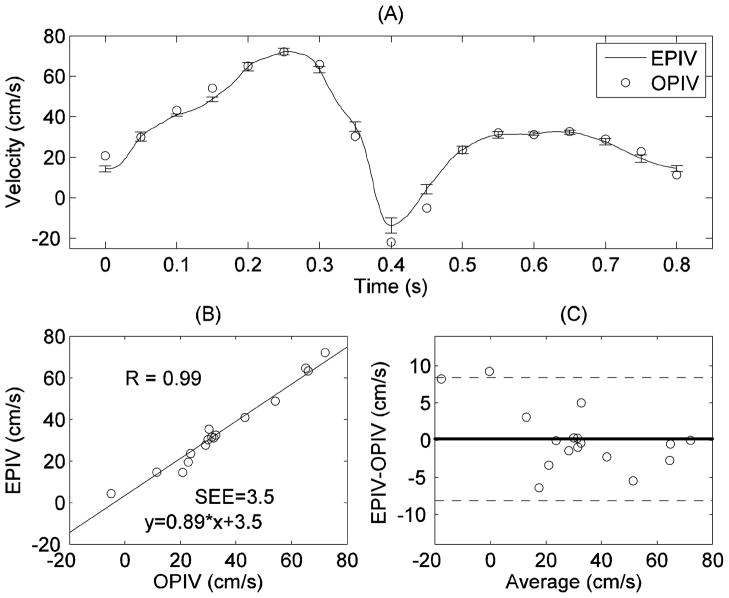
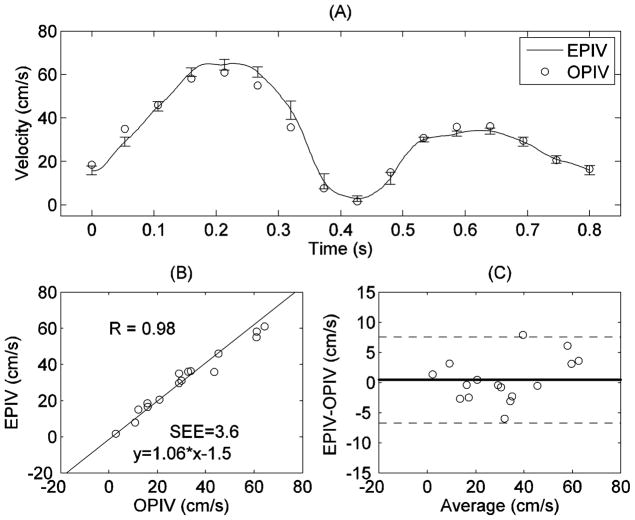
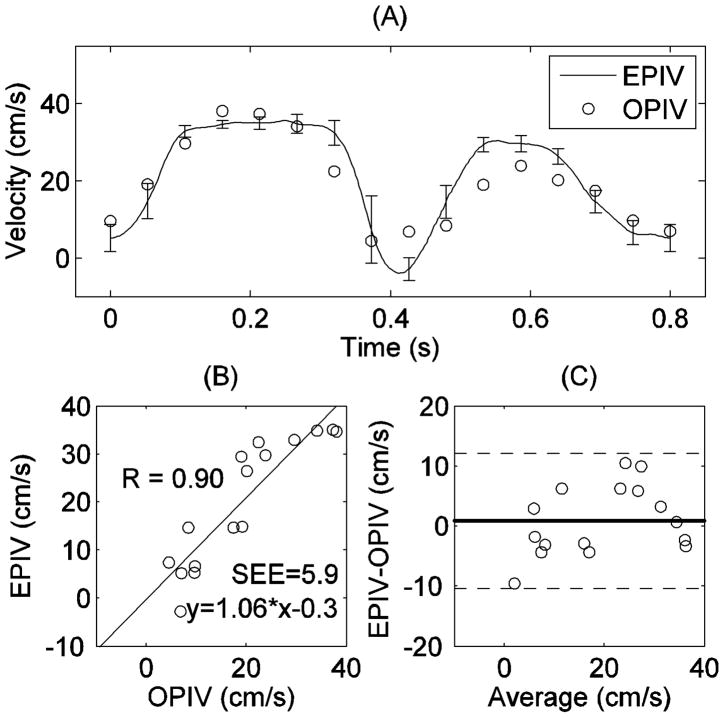
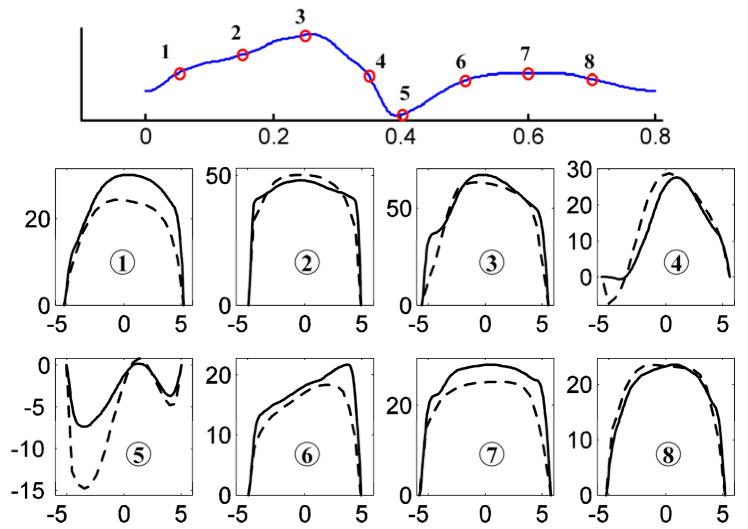
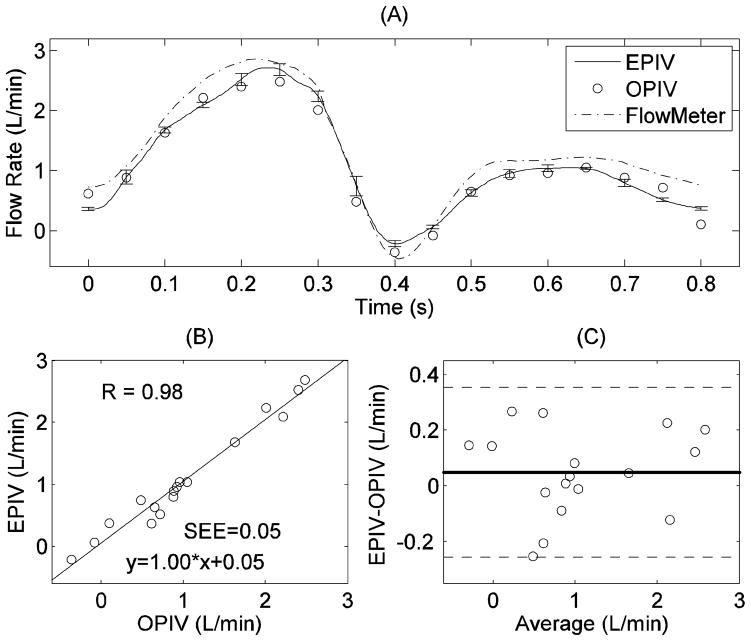
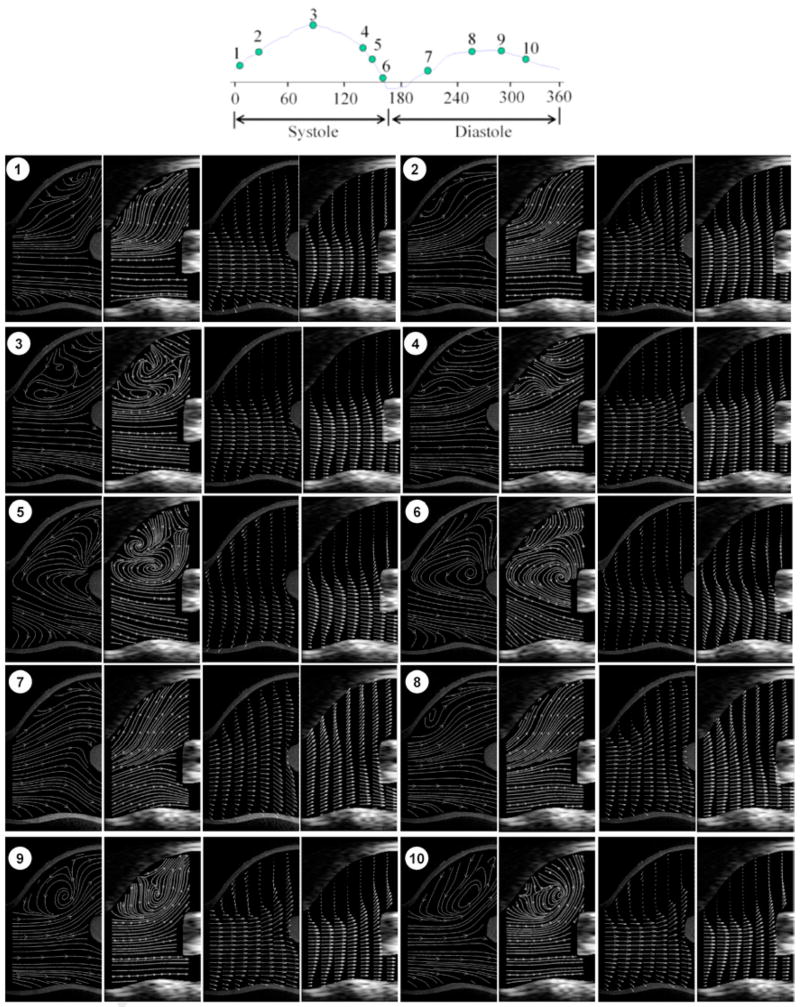
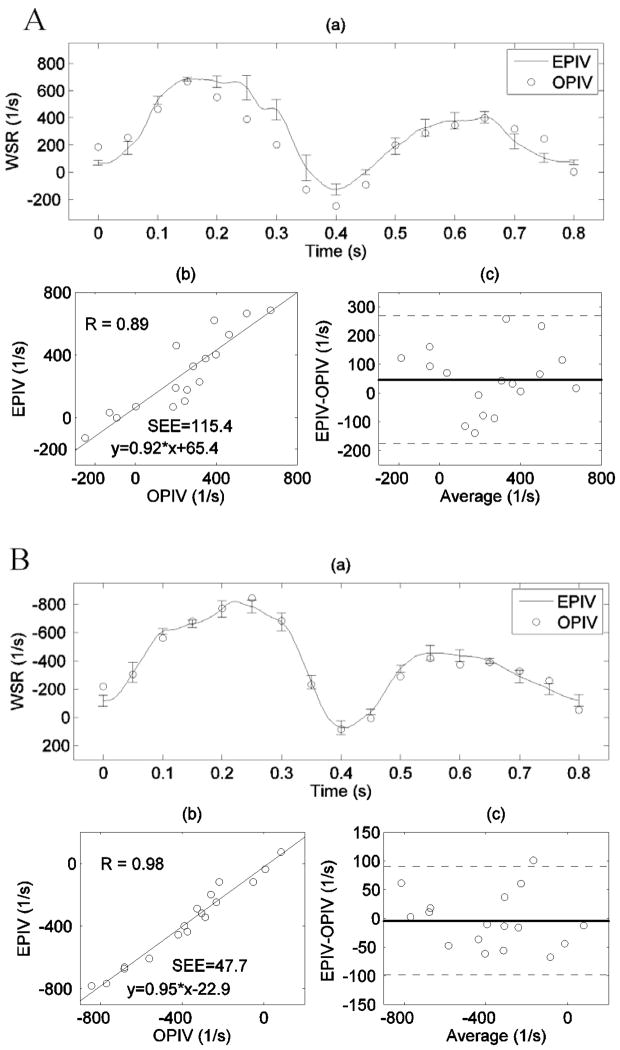
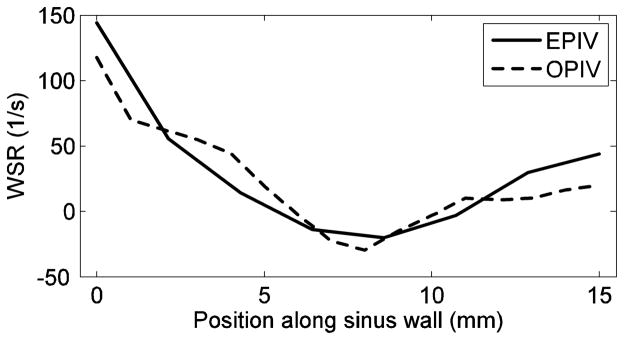
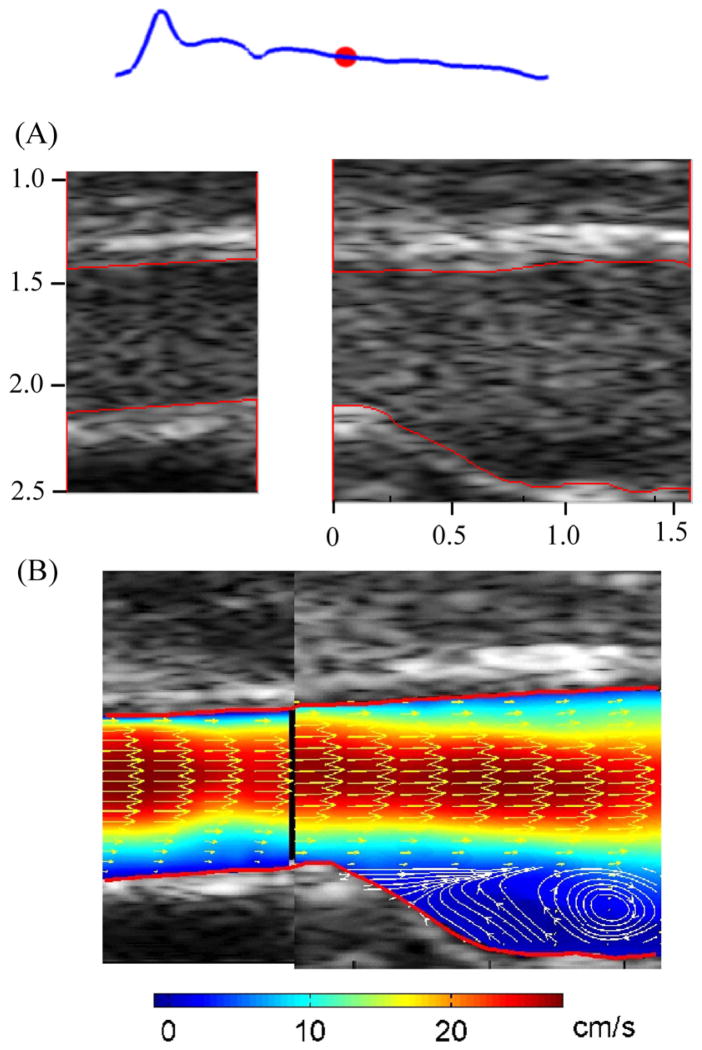
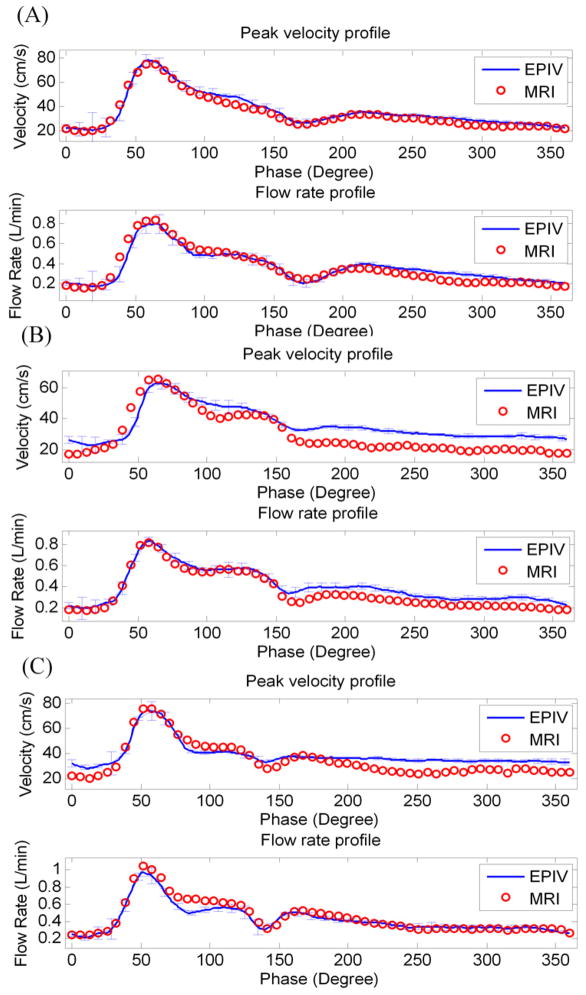
Noninvasive, easy-to-use and accurate measurements of wall shear stress (WSS) in human blood vessels have always been challenging in clinical applications. Echo particle image velocimetry (Echo PIV) has shown promise for clinical measurements of local hemodynamics and wall shear rate. Thus far, however, the method has only been validated under simple flow conditions. In this study, we validated Echo PIV under in vitro and in vivo conditions. For in vitro validation, we used an anatomically correct, compliant carotid bifurcation flow phantom with pulsatile flow conditions, using optical particle image velocimetry (optical PIV) as the reference standard. For in vivo validation, we compared Echo PIV-derived 2-D velocity fields obtained at the carotid bifurcation in five normal subjects against phase-contrast magnetic resonance imaging (PC-MRI)-derived velocity measurements obtained at the same locations. For both studies, time-dependent, 2-D, two-component velocity vectors; peak/centerline velocity, flow rate and wall shear rate (WSR) waveforms at the common carotid artery (CCA), carotid bifurcation and distal internal carotid artery (ICA) were examined. Linear regression, correlation analysis and Bland-Altman analysis were used to quantify the agreement of different waveforms measured by the two techniques. In vitro results showed that Echo PIV produced good images of time-dependent velocity vector maps over the cardiac cycle with excellent temporal (up to 0.7 ms) and spatial (∼0.5 mm) resolutions and quality, comparable with optical PIV results. Further, good agreement was found between Echo PIV and optical PIV results for velocity and WSR measurements. In vivo results also showed good agreement between Echo PIV velocities and phase contrast MRI velocities. We conclude that Echo PIV provides accurate velocity vector and WSR measurements in the carotid bifurcation and has significant potential as a clinical tool for cardiovascular hemodynamics evaluation.
Copyright © 2011 World Federation for Ultrasound in Medicine & Biology. Published by Elsevier Inc. All rights reserved.
Figures
References
-
- Azhim A, Utsunomiya Y, Akioka K, Akutagawa M, Yoshizaki K, Obara S, Nomura M, Tanaka H, Kinouchi Y. Influence of aging and gender on blood velocity in the human common carotid artery, accounted for by body size. Journal of Aging and Physical Activity. 2008;16:S30–S31.
-
- Beulen B, Bijnens N, Rutten M, Brands P, van de Vosse F. Perpendicular ultrasound velocity measurement by 2D cross correlation of RF data. Part A: validation in a straight tube Experiments in Fluids. 2010
-
- Beulen B, Bijnens N, Rutten M, Brands P, van de Vosse F. Perpendicular ultrasound velocity measurement by 2D cross correlation of RF data. Part B: volume flow estimation in curved vessels Experiments in Fluids. 2010
-
- Bland JM, Altman DG. Statistical-Methods for Assessing Agreement between 2 Methods of Clinical Measurement. Lancet. 1986;1:307–10. - PubMed
-
- Carallo C, Irace C, Pujia A, De Franceschi MS, Crescenzo A, Motti C, Cortese C, Mattioli PL, Gnasso A. Evaluation of common carotid hemodynamic forces - Relations with wall thickening. Hypertension. 1999;34:217–21. - PubMed
Publication types
MeSH terms
Grants and funding
LinkOut - more resources
Full Text Sources
Other Literature Sources
Research Materials
Miscellaneous
