. 2011 Feb 15;19(2):177-91.
doi: 10.1016/j.ccr.2010.12.023.

Evidence for an unanticipated relationship between undifferentiated pleomorphic sarcoma and embryonal rhabdomyosarcoma

Affiliations

Evidence for an unanticipated relationship between undifferentiated pleomorphic sarcoma and embryonal rhabdomyosarcoma

Brian P Rubin et al. Cancer Cell. .

Abstract

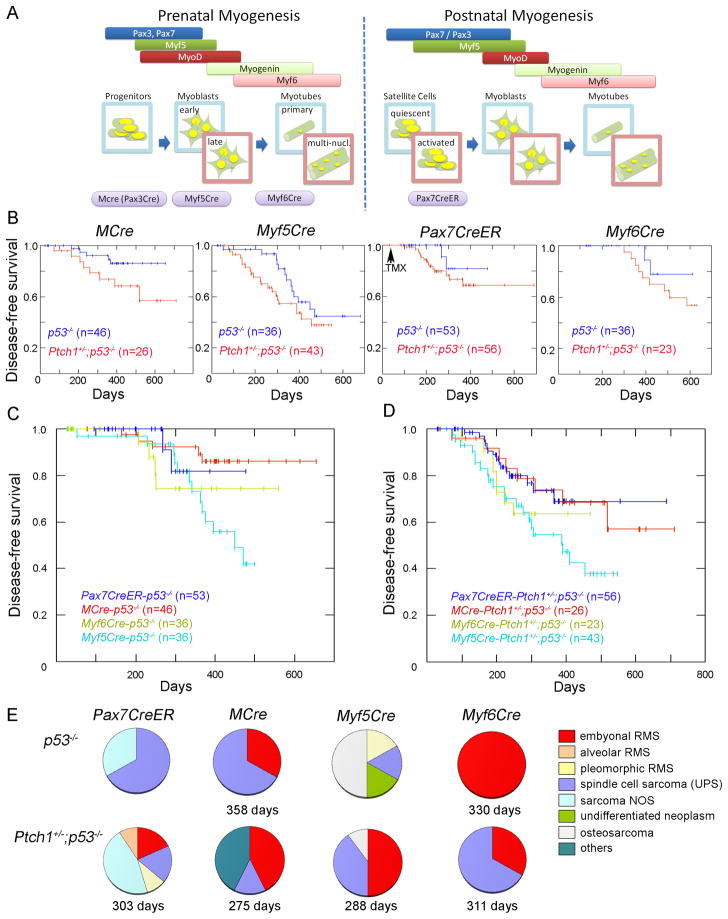
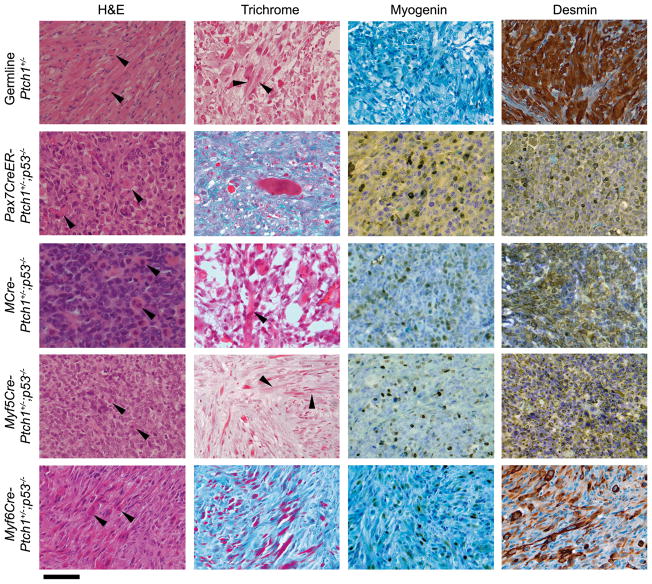
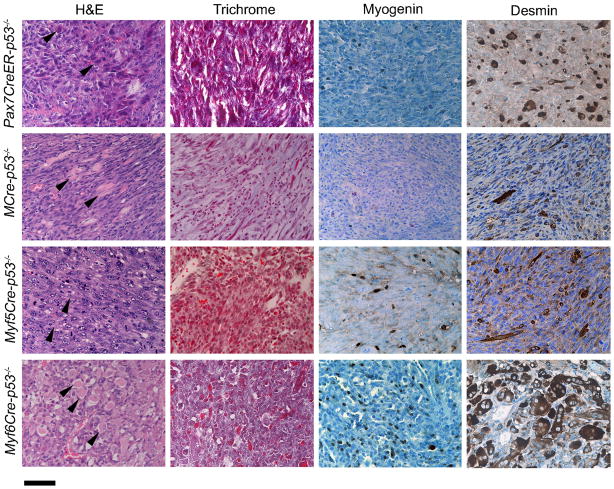
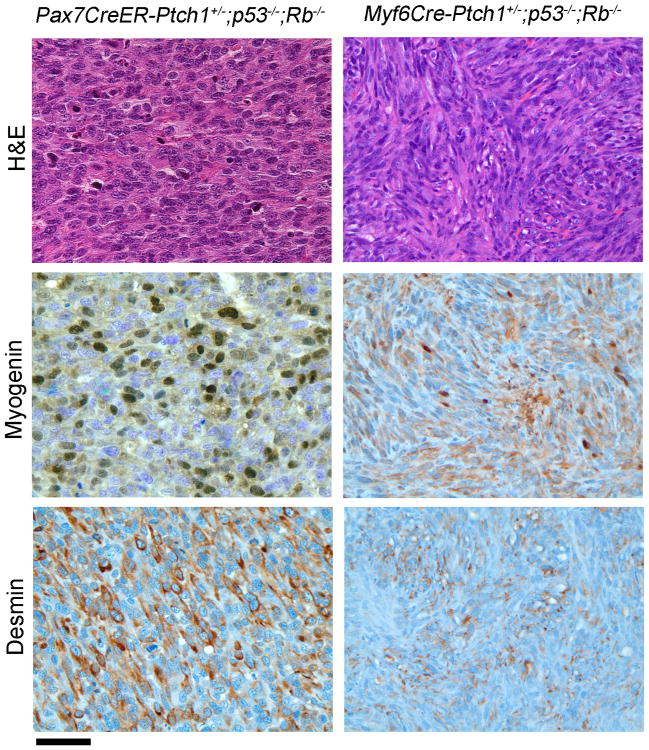
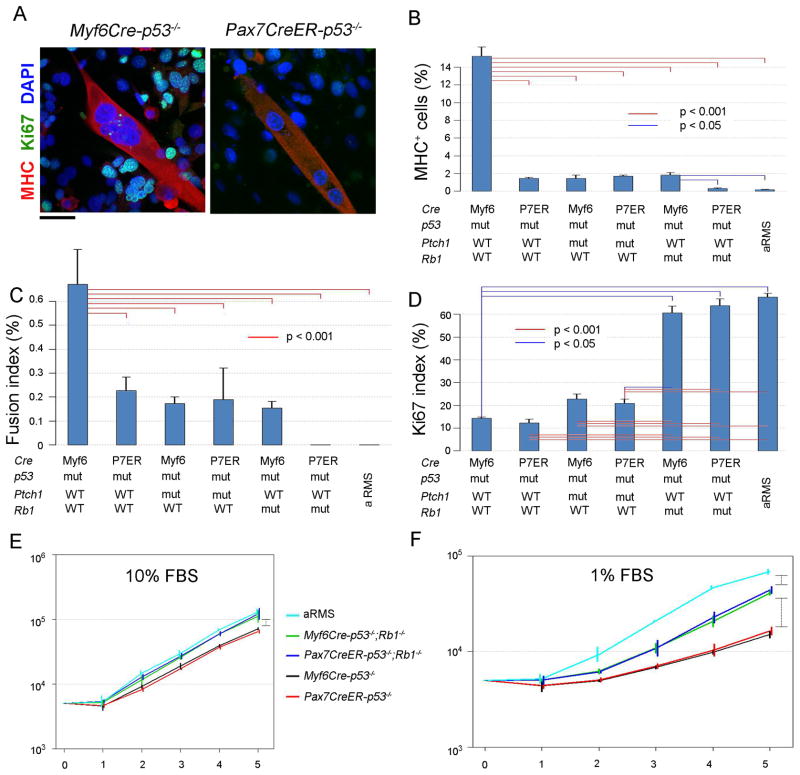
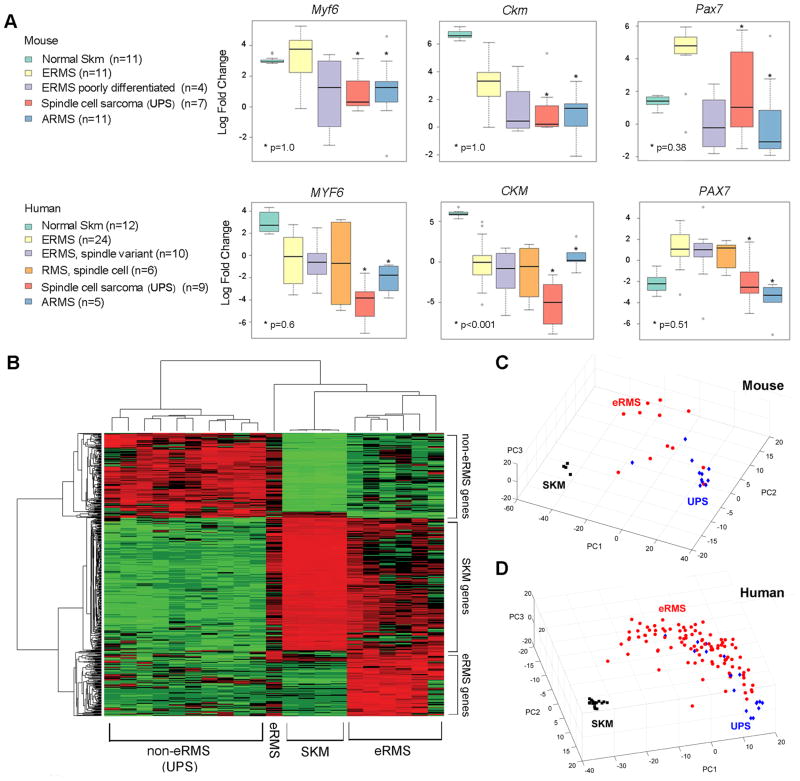
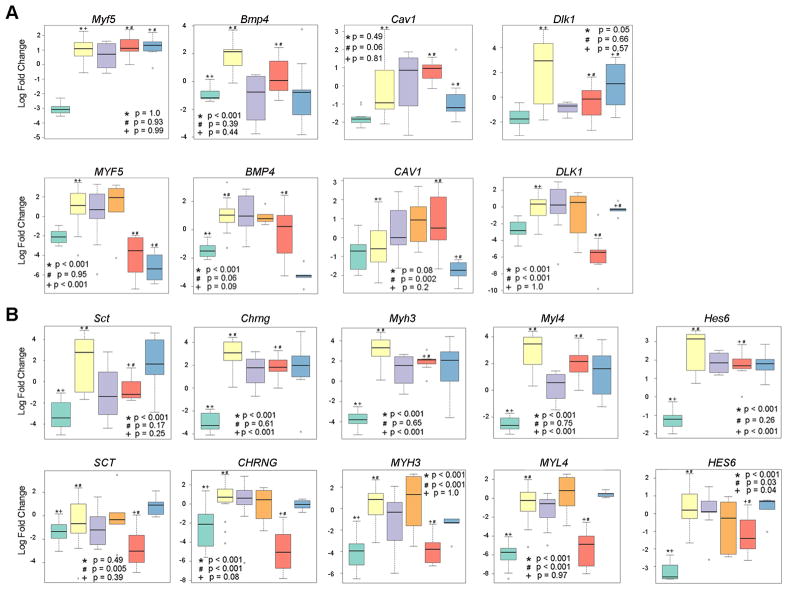
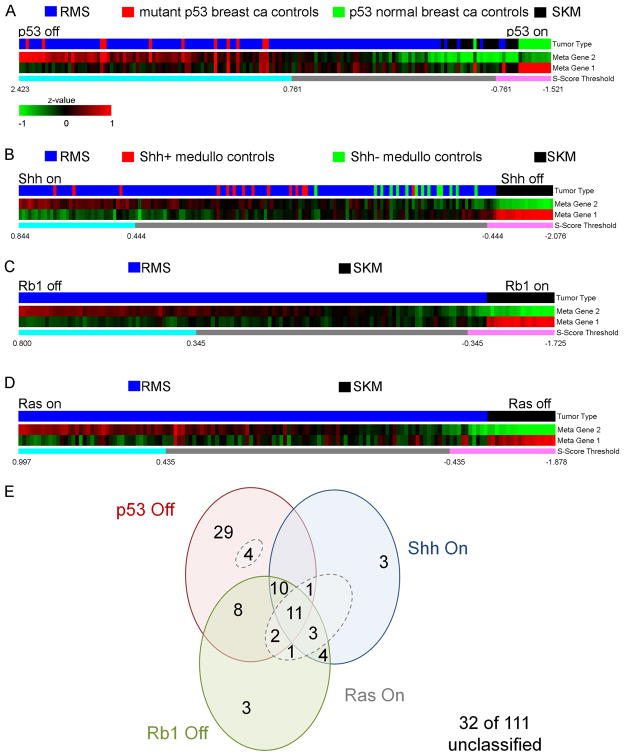
Embryonal rhabdomyosarcoma (eRMS) shows the most myodifferentiation among sarcomas, yet the precise cell of origin remains undefined. Using Ptch1, p53 and/or Rb1 conditional mouse models and controlling prenatal or postnatal myogenic cell of origin, we demonstrate that eRMS and undifferentiated pleomorphic sarcoma (UPS) lie in a continuum, with satellite cells predisposed to giving rise to UPS. Conversely, p53 loss in maturing myoblasts gives rise to eRMS, which have the highest myodifferentiation potential. Regardless of origin, Rb1 loss modifies tumor phenotype to mimic UPS. In human sarcomas that lack pathognomic chromosomal translocations, p53 loss of function is prevalent, whereas Shh or Rb1 alterations likely act primarily as modifiers. Thus, sarcoma phenotype is strongly influenced by cell of origin and mutational profile.


Figures

Figure 1
Figure 1. Survival analysis and tumor histology of each genotype
(A) Representation of prenatal and postnatal myogenesis in the context of Cre drivers used to activate tumorigenesis in this study. multi-nucl., multi-nucleated. (B) Disease-free survival is shown as a Kaplan Meier curve for conditionally homozygous p53 deleted mice with or without conditional Patched1 (Ptch1) haploinsufficiency, using different Cre alleles. (C–D) Comparison of disease–free survival in different Cre mice when p53 alleles were conditionally, homozygously deleted (B), or when p53 alleles were conditionally, homozygously deleted concurrently with heterozygous conditional Ptch1 deletion (C). The difference between p53 and Ptch1-p53 disease-free survival did not reach statistical significance by the log rank test (p>0.05). (E) Histological classification. Mean latency of embryonal rhabdomyosarcoma (eRMS; red slices) is shown below each pie chart. See also Figure S1 and Tables S1, S2 and S3.
Figure 2
Figure 2. Histological analysis of Ptch1+/;p53/ eRMS for each Cre line
Genotypes are indicated in column headings. A tumor from a mouse with germline deletion of the Ptch1 gene is shown as a typical case of eRMS (left column). H&E staining, Masson s trichrome, and immunohistochemical staining for Myogenin and Desmin were performed for diagnosis of all tumors. Arrowheads point to eosinophilic strap-like epithelioid rhabdomyoblasts in H&E panels. Cross striations are shown on trichrome (some cases; arrowheads). Scale bar, 40 μm.
Figure 3
Figure 3. Histological analysis of p53/ eRMS in each Cre line
Representative cases with eRMS are presented. H&E staining, Masson s trichrome, and immunohistochemical staining of Myogenin and Desmin were performed for diagnosis of all tumors. Eosinophilic rhabdomyoblasts are highlighted by arrows. Scale bar, 40 μm.
Figure 4
Figure 4. Histology of Ptch1+/;p53/;Rb1/ eRMS from Pax7CreER and Myf6Cre lines
Shown are the areas with the most immunoreactivity. The majority of the tumors did not exhibit immunopositivity. Histologically, tumors appeared as either poorly differentiated epithelioid cell (left) or spindle cell (right) neoplasms and only showed rhabdomyoblastic differentiation by immunohistochemistry. Scale bar, 40 μm. See also Figure S2.
Figure 5
Figure 5. Cellular phenotypes of primary tumor cell cultures vary by cell of origin and mutation profile
(A) Cell lines from both Myf6Cre-p53 and Pax7CreER-p53 tumors formed multinuclear myotubes, which were positive for myosin heavy chain (MHC). scale bar, 40 μm. (B) Percentage of MHC-positive cells was calculated in each cell line. Total cells in 5 views of 100x fields were counted in each cell line. WT, wild type. mut, mutant. aRMS, alveolar rhabdomyosarcoma tumors from Myf6Cre-Pax3P3F/P3F;p53/ mice. (C) Fusion index (percentage of cells with MHC-positive (MHC+) multi-nuclear myotubes /total cells) was calculated. (D) Ki67 index (percentage of Ki67-positive cells /total cells) was calculated. (E–F) In vitro growth properties of each cell line under normal (10% fetal bovine serum (FBS), E) and low (1% FBS, F) serum conditions. Vertically oriented brackets represent comparisons for which p values are < 0.001. For all panels in this figure, p values represents ANOVA with Tukey's multiple testing correction. For Figure 5B–C, values were log transformed. Rank order was used for Figure 5D. Error bars represent SEM.
Figure 6
Figure 6. Continuum of Gene Expression Features in Mouse and Human Sarcomas
(A) Expression of myogenic markers in mouse and human SKM, eRMS, UPS and intermediate diagnoses. aRMS is shown in comparison. Mouse genes have the first letter capitalized, whereas human genes have all letters capitalized. Error bars represent SEM. (B) Supervised clustering identified the genes specifically up-regulated in each group, eRMS, non--eRMS (UPS), and skeletal muscles (SKM) (raw p-value <0.05 & fold change>2). A gene list of eRMS specific genes is shown as Table S2. Tumors analyzed are Ptch1,p53 tumors without Rb1 deletions from Pax7CreER, MCre, Myf5Cre, and Myf6Cre lineages. (C) Principal component analysis for mouse tumors using the 345 signature genes that differentiated ERMS (red) and UPS (blue) mouse tumors from normal skeletal muscle (black). (D) Principal component analysis for human RMS, UPS and normal skeletal muscle samples using 283 significant probes that reached significance (p-value < 0.05 & fold change > 1.5).
Figure 7
Figure 7. Gene Expression Classifiers and Phenotypes in Mouse and Human Sarcomas
(A) Expression of genes that as a profile differentiate SKM, eRMS, USCS/UPS and aRMS in humans, with corresponding graphs from mouse models. Pax7 is included in this five gene profile, but Pax7 expression data is presented in Figure 6A. (B) Markers of activated satellite cells found to be highly expressed in mouse and human eRMS. Mouse genes have the first letter capitalized, whereas human genes have all letters capitalized. See also Figure S2. Error bars represent SEM. See also Tables S4 and S5.
Figure 8
Figure 8. Heatmaps of human fusion-negative rhabdomyosarcomas for gene signatures representing the p53, Shh and Rb1 pathways
(A) The p53 pathway heatmap represented as two metagenes was generated based on 320 significant genes (Benjamini and Hochberg adjusted p-value <0.05 & fold change > 2) with 183 genes were in metagene 1, whereas the other 136 genes were in metagene 2. In total, 65 of 111 fusion-negative RMS primary tumor samples (59%) exhibited a gene expression signature consistent with the p53 off state for which the S-score was greater than 0.761 (see Supplemental Experimental Procedures). All human breast cancer control samples with known p53 mutations also exhibited S-scores greater than 0.761. (B) For the Shh signaling pathway heatmap, 111 genes were employed, 56 of which were in metagene 1, the other 55 genes were in metagene 2. Overall, 32 of 111 (29%) of tumors exhibited a gene expression signature consistent with a Shh on overdrive state for which S-score was greater than 0.444. The p-value for comparison of the S-score for Shh+ medulloblastoma controls and for Shh- medulloblastoma controls was 2.62x10⁻⁵ as calculated by the Wilcoxon rank sum test. (C) For the Rb1 pathway, 381 genes were used to construct the heatmap, with 157 in metagene 1, and 224 genes in metagene 2. For the Rb1 pathway, 42 of 111 (38%) of samples demonstrated an Rb1 off state with an S-score greater than 0.345. (D) To evaluate the Ras pathway, 87 genes common to zebrafish eRMS and human Ras-driven pancreatic cancer were used to construct the heatmap, with 24 genes in metagene 1, and 63 genes in metagene 2. For the Ras pathway, 25 of 111 of samples demonstrated a Ras on state with an S-score greater than 0.477, but after exclusion of 2 samples that did not also contain a Ras signature common to Ras-activated mammary epithelial cells, only 23 of 111 samples (21%) were felt to have a strict Ras signature. None of the Ras signature samples (breast similar or pancreatic similar) had a Ras activation signature in the absence of mutant p53, Shh or Rb1 signatures. (E) Venn diagram showing the intersection of signatures amongst human fusion-negative soft tissue sarcomas. ca, cancer. Ras On samples are encircled with dotted lines. See also Figure S3 and Tables S6–S10.

Comment in

References

    1. Arndt CA, Hammond S, Rodeberg D, Qualman S. Significance of persistent mature rhabdomyoblasts in bladder/prostate rhabdomyosarcoma: Results from IRS IV. J Pediatr Hematol Oncol. 2006;28:563–567. - PubMed
    1. Barr FG, Smith LM, Lynch JC, Strzelecki D, Parham DM, Qualman SJ, Breitfeld PP. Examination of gene fusion status in archival samples of alveolar rhabdomyosarcoma entered on the Intergroup Rhabdomyosarcoma Study-III trial: a report from the Children's Oncology Group. J Mol Diagn. 2006;8:202–208. - PMC - PubMed
    1. Beauchamp JR, Heslop L, Yu DS, Tajbakhsh S, Kelly RG, Wernig A, Buckingham ME, Partridge TA, Zammit PS. Expression of CD34 and Myf5 defines the majority of quiescent adult skeletal muscle satellite cells. J Cell Biol. 2000;151:1221–1234. - PMC - PubMed
    1. Beddis IR, Mott MG, Bullimore J. Case report: nasopharyngeal rhabdomyosarcoma and Gorlin's naevoid basal cell carcinoma syndrome. Med Pediatr Oncol. 1983;11:178–179. - PubMed
    1. Breneman JC, Lyden E, Pappo AS, Link MP, Anderson JR, Parham DM, Qualman SJ, Wharam MD, Donaldson SS, Maurer HM, et al. Prognostic factors and clinical outcomes in children and adolescents with metastatic rhabdomyosarcoma--a report from the Intergroup Rhabdomyosarcoma Study IV. J Clin Oncol. 2003;21:78–84. - PubMed

Publication types

Associated data