. 2011 Mar 1;25(5):460-70.
doi: 10.1101/gad.2016311. Epub 2011 Feb 11.

Activated Ras requires autophagy to maintain oxidative metabolism and tumorigenesis

Affiliations

Activated Ras requires autophagy to maintain oxidative metabolism and tumorigenesis

Jessie Yanxiang Guo et al. Genes Dev. .

Abstract

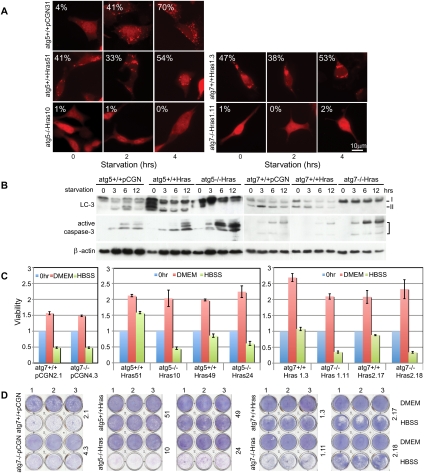
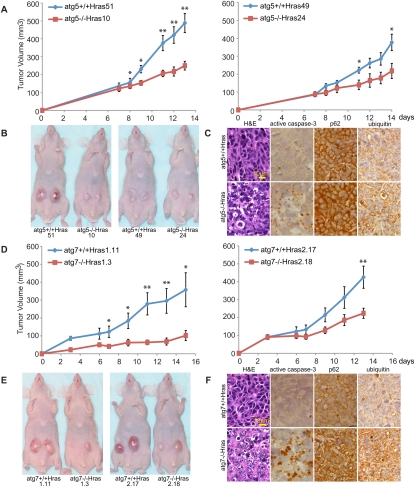
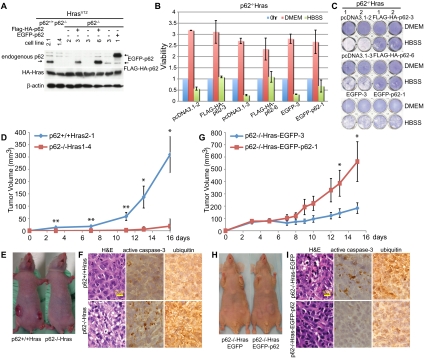
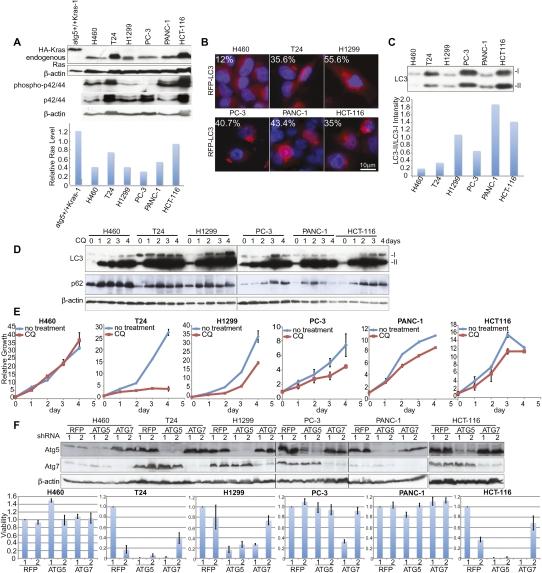
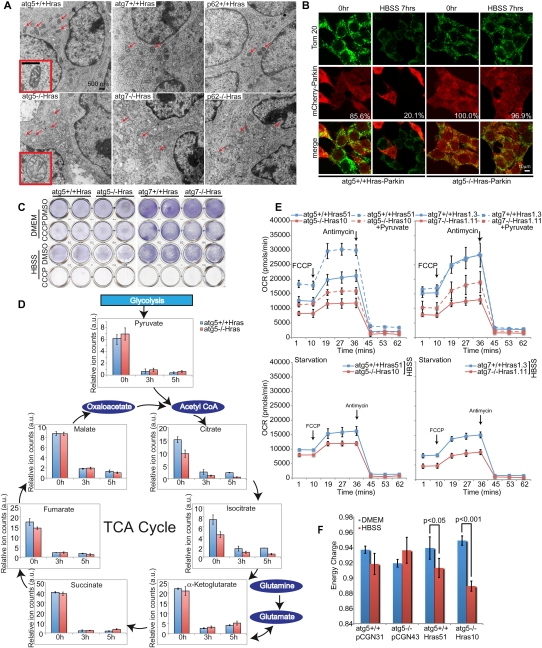
Autophagy is a catabolic pathway used by cells to support metabolism in response to starvation and to clear damaged proteins and organelles in response to stress. We report here that expression of a H-ras(V12) or K-ras(V12) oncogene up-regulates basal autophagy, which is required for tumor cell survival in starvation and in tumorigenesis. In Ras-expressing cells, defective autophagosome formation or cargo delivery causes accumulation of abnormal mitochondria and reduced oxygen consumption. Autophagy defects also lead to tricarboxylic acid (TCA) cycle metabolite and energy depletion in starvation. As mitochondria sustain viability of Ras-expressing cells in starvation, autophagy is required to maintain the pool of functional mitochondria necessary to support growth of Ras-driven tumors. Human cancer cell lines bearing activating mutations in Ras commonly have high levels of basal autophagy, and, in a subset of these, down-regulating the expression of essential autophagy proteins impaired cell growth. As cancers with Ras mutations have a poor prognosis, this "autophagy addiction" suggests that targeting autophagy and mitochondrial metabolism are valuable new approaches to treat these aggressive cancers.


Figures

Figure 1.
Figure 1.
H-rasV12-expressing cells are dependent on autophagy to survive starvation. (A) Autophagy-competent (atg5+/+ and atg7+/+) or authophagy-deficient (atg5−/− and atg7−/−) cells expressing H-rasV12 or vector were transiently transfected with the fluorescent autophagosome marker p-tFL-LC3 and subjected to starvation. Representative images depict RFP-LC3 localization. Numbers indicate percentage of cells with LC3 translocation to autophagosomes (punctate localization). (B) Evaluation for processing of endogenous LC3-I to LC3-II indicative of autophagy induction and activation of caspase-3 (apoptosis). (C) Ras-expressing cells were treated with HBSS for 12–20 h, and cell viability was examined by a trypan blue exclusion-based cell viability analyzer and normalized to untreated cells at the time of initiation of starvation. (D) Cells treated as in C were allowed to recover in normal medium for 2 d and assessed for clonogenic survival.
Figure 2.
Figure 2.
Autophagy supports Ras tumorigenesis. (A) Tumor growth of Ras-expressing atg5+/+ and atg5−/− cells. Error bars represent standard errors. (*) P < 0.05; (**) P < 0.01 (t-test). (B) Representative tumor-bearing mice at day 13 (51 and 10) or day 15 (49 and 24) post-injection from A. (C) Histology (H&E) and immunohistochemistry for active caspase-3, p62, or Ub in tumors from A. (D–F) Ras-expressing atg7−/− tumors show reduced growth, elevated apoptosis, and accumulation of p62 and Ub. Error bars represent standard errors. (*) P < 0.05; (**) P < 0.01 (t-test).
Figure 3.
Figure 3.
p62 is required for efficient tumorigenesis by Ras. (A) HA-tagged H-rasV12 was stably expressed in p62+/+ and p62−/− iBMK cells in which p62 expression was reconstituted. Western blot shows the protein level of HA-HrasV12, Flag-HA-p62, EGFP-p62, and endogenous p62. (B,C) p62−/−-HrasV12 cells expressing vector or p62 were treated with HBSS for 16 h and then analyzed for viability (B) and clonogenic survival (C) as described in Figure 1, C and D. (D) Tumorigenesis of Ras-expressing, p62+/+, or p62−/− iBMK cells. Error bars represent standard errors. (*) P < 0.05; (**) P < 0.01 (t-test). (E) Mice at day 16 post-injection from D. (F) H&E and immunohistochemistry for activated caspase-3 and Ub in tumors from D. (G) Tumor growth of p62−/−-HrasV12 iBMK cells expressing EGFP or EGFP-p62. Error bars represent standard errors. (*) P < 0.05; (**) P < 0.01 (t-test). (H) Mice from G at day 15 post-injection. (I) H&E and immunohistochemistry of tumors from G.
Figure 4.
Figure 4.
Sensitivity of human cancer cell lines with activating Ras mutations to autophagy inhibition. (A, top panel) Western blot shows the protein level of HA-K-rasV12 in an iBMK cell line, endogenous Ras, phospho-p42/44, and p42/44 in human cancer cell lines. The bottom graph shows quantification of Ras levels relative to β-actin. (B) Human cancer cells were transiently transfected with the fluorescent autophagosome marker p-tFL-LC3 and cultured in nutrient-replete conditions. Representative images depict RFP-LC3 localization. Numbers indicate percentage of cells with LC3 translocation to autophagosomes (punctate localization). (C, top panel) Human cancer cells were cultured under nutrient-replete conditions and collected at 30% of confluence to evaluate processing of endogenous LC3-I to LC3-II. (Bottom panel) The ratio of LC3-II to LC3-I expression is shown quantitatively as a graph. (D) Evaluation of processing of endogenous LC3-I to LC3-II of human cancer cell lines under CQ (30 μM) treatment to block flux through the autophagy pathway. Human cancer cells were cultured under nutrient-replete conditions, treated with CQ when cells were 25%–30% confluent, and assessed in comparison with cells at the start of CQ administration. (E) Growth curve of six different cancer cell lines treated with 30 μM CQ from D. (F, top panel) Western blot shows expression of Atg5 and Atg7. (Bottom panel) Cell viability of six different cancer cell lines in response to lentiviral shRNA knockdown of essential autophagy regulators Atg5 and Atg7.
Figure 5.
Figure 5.
Autophagy maintains mitochondrial oxidative metabolism. (A) Representative EMs show the accumulation of dysmorphic mitochondria (arrows) of Ras-expressing, autophagy-defective tumors. Insets show typical mitochondrial morphology. (B) mCherry-Parkin-expressing cells were treated with HBSS for 7 h, then fixed and stained with the mitochondrial marker Tom20. Representative images show mitochondrial clearance in atg5+/+ cells during starvation (reduction in Parkin- and Tom 20-positive cells). Numbers indicate percentage of Parkin-expressing cells. (C) Autophagy-competent or autophagy-deficient cells expressing Ras were pretreated with CCCP (20 μM) for 4 h to induce mitochondrial uncoupling, and then subjected to HBSS + CCCP treatment for another 4 h. Cells were allowed to recover for 20 h and assessed for clonogenic survival. DMSO was used for CCCP control. (D) Pool sizes of major TCA cycle intermediates in atg5+/+-Hras and atg5−/−-Hras cells under nutrient-replete and starvation conditions. Graphs showing cell number normalized relative pool sizes (arbitrary unit [a.u.]) of major TCA metabolites by LC-MS in HBSS for the indicated times. (E) Oxygen consumption rates in cells under nutrient-replete conditions, following addition of FCCP (1.5 μM) to establish maximum respiratory capacity and complex III inhibitor anti-mycin (20 μM) to inhibit mitochondrial respiration. Measurements were done in DMEM without and with sodium pyruvate (0.11 g/L) (top panels) or in HBSS (bottom panel). (F) EC ([ATP] + [0.5ADP])/([ATP] + [ADP] + [AMP]) in atg5+/+ and atg5−/− cells without or with Ras under nutrient-replete and starvation conditions.

Comment in

References

    1. Choi SW, Gerencser AA, Nicholls DG 2009. Bioenergetic analysis of isolated cerebrocortical nerve terminals on a microgram scale: spare respiratory capacity and stochastic mitochondrial failure. J Neurochem 109: 1179–1191 - PMC - PubMed
    1. Degenhardt K, Chen G, Lindsten T, White E 2002a. BAX and BAK mediate p53-independent suppression of tumorigenesis. Cancer Cell 2: 193–203 - PubMed
    1. Degenhardt K, Sundararajan R, Lindsten T, Thompson C, White E 2002b. Bax and Bak independently promote cytochrome C release from mitochondria. J Biol Chem 277: 14127–14134 - PubMed
    1. Degenhardt K, Mathew R, Beaudoin B, Bray K, Anderson D, Chen G, Mukherjee C, Shi Y, Gelinas C, Fan Y, et al. 2006. Autophagy promotes tumor cell survival and restricts necrosis, inflammation, and tumorigenesis. Cancer Cell 10: 51–64 - PMC - PubMed
    1. Dranka BP, Hill BG, Darley-Usmar VM 2010. Mitochondrial reserve capacity in endothelial cells: the impact of nitric oxide and reactive oxygen species. Free Radic Biol Med 48: 905–914 - PMC - PubMed

Publication types