. 2011 Apr;155(4):2066-80.
doi: 10.1104/pp.110.169813. Epub 2011 Feb 11.

Whole genome analysis of gene expression reveals coordinated activation of signaling and metabolic pathways during pollen-pistil interactions in Arabidopsis

Affiliations

Whole genome analysis of gene expression reveals coordinated activation of signaling and metabolic pathways during pollen-pistil interactions in Arabidopsis

Leonor C Boavida et al. Plant Physiol. 2011 Apr.

Abstract

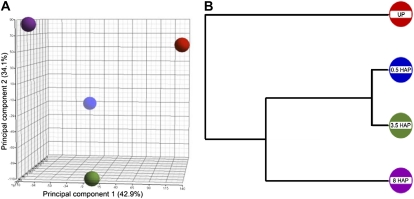
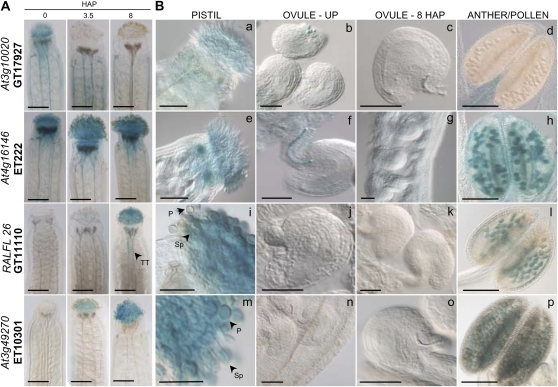
Plant reproduction depends on the concerted activation of many genes to ensure correct communication between pollen and pistil. Here, we queried the whole transcriptome of Arabidopsis (Arabidopsis thaliana) in order to identify genes with specific reproductive functions. We used the Affymetrix ATH1 whole genome array to profile wild-type unpollinated pistils and unfertilized ovules. By comparing the expression profile of pistils at 0.5, 3.5, and 8.0 h after pollination and applying a number of statistical and bioinformatics criteria, we found 1,373 genes differentially regulated during pollen-pistil interactions. Robust clustering analysis grouped these genes in 16 time-course clusters representing distinct patterns of regulation. Coregulation within each cluster suggests the presence of distinct genetic pathways, which might be under the control of specific transcriptional regulators. A total of 78% of the regulated genes were expressed initially in unpollinated pistil and/or ovules, 15% were initially detected in the pollen data sets as enriched or preferentially expressed, and 7% were induced upon pollination. Among those, we found a particular enrichment for unknown transcripts predicted to encode secreted proteins or representing signaling and cell wall-related proteins, which may function by remodeling the extracellular matrix or as extracellular signaling molecules. A strict regulatory control in various metabolic pathways suggests that fine-tuning of the biochemical and physiological cellular environment is crucial for reproductive success. Our study provides a unique and detailed temporal and spatial gene expression profile of in vivo pollen-pistil interactions, providing a framework to better understand the basis of the molecular mechanisms operating during the reproductive process in higher plants.


Figures

Figure 1.
Figure 1.
PCA and hierarchical clustering of time-course transcriptome data. A, PCA is an exploratory technique used to describe the structure of high-dimensional data (e.g. derived from microarrays) by reducing its dimensionality. Here, expression values for approximately 22,400 genes during the four time points are projected onto the first three principal components. B, Hierarchical clustering was used to group similar objects into “clusters,” producing a tree (called a dendrogram) that shows the hierarchy of the clusters. [See online article for color version of this figure.]
Figure 2.
Figure 2.
Clustering analysis of the time-course profile of pollen-pistil interactions. The expression values of 1,373 genes were normalized to the baseline (UP; time 0), and the ratios were log2 transformed to reveal expression kinetics. Genes were clustered using the SOTA array clustering method (GEPAS) and organized in a hierarchical tree (SOTATREE). Total number of genes is given in gray circles, ordered from top to bottom. Graphs show expression patterns for all genes within each cluster along the time course; the thick line indicates the average expression trend line for each cluster. Clusters are numbered from left to right and top to bottom.
Figure 3.
Figure 3.
RT-PCR analysis of genes regulated during pollen-pistil interactions. A, Confirmation of changes in expression for several regulated genes during the time course. B, Expression of several time-course-regulated genes classified as EBP (expressed before pollination), IBP (induced by pollination), and PEP (pollen enriched or preferentially expressed) and corresponding expression reproductive and vegetative tissues. TUB4 (At5g04180) was used as a positive control. The number of the hierarchical cluster is indicated for each gene.
Figure 4.
Figure 4.
Histochemical detection of GUS enzymatic activity in gene trap (DsG) and enhancer trap (DsE) lines. A, Young pistils were emasculated and pollinated 24 h later. GUS activity was assayed at specific time points after pollination (0, 3.5, and 8.0 HAP) for each insertion line. B, GUS activity was assayed in different tissues: UP (a and e), 8HAP pistils (i and m), unfertilized ovules (b, f, j, and n), 8HAP fertilized ovules (c, g, k, and o), and dehiscent anthers/mature pollen (d, h, l, and p). Arrowheads show pollen (P), stigma papillae (Sp), and transmitting tract (TT). Bars = 400 μm for A and for B as follows: a, e, m, and i, 100 μm; b, c, f, g, j, k, n, and o, 50 μm; d, h, l, and p, 400 μm. [See online article for color version of this figure.]
Figure 5.
Figure 5.
Predictions of subcellular localization for proteins regulated during pollen-pistil interactions. Wedges indicate the percentage of proteins assigned to each subcellular localization according to The Arabidopsis Information Resource 9.0 prediction. Whole charts represent proportions in the ATH1 array, PPI (genes regulated during pollen-pistil interactions), and in categories of genes expressed before pollination, induced after pollination, and in the subset of genes pollen enriched or preferentially expressed and regulated during the time course.
Figure 6.
Figure 6.
Signal transduction and cell wall families regulated during pollen-pistil interactions. A, Cell wall families. B, Signal transduction families. Values represent percentages of genes assigned to each family on the ATH1 array and regulated during pollen-pistil interactions, as indicated. [See online article for color version of this figure.]

Similar articles

Cited by

References

    1. Aloni R, Aloni E, Langhans M, Ullrich CI. (2006) Role of auxin in regulating Arabidopsis flower development. Planta 223: 315–328 - PubMed
    1. Becker JD, Boavida LC, Carneiro J, Haury M, Feijó JA. (2003) Transcriptional profiling of Arabidopsis tissues reveals the unique characteristics of the pollen transcriptome. Plant Physiol 133: 713–725 - PMC - PubMed
    1. Becker JD, Feijó JA. (2007) How many genes are needed to make a pollen grain? Lessons from transcriptomics. Ann Bot (Lond) 100: 1117–1123 - PMC - PubMed
    1. Boavida LC, Becker JD, Feijó JA. (2005a) The making of gametes in higher plants. Int J Dev Biol 49: 595–614 - PubMed
    1. Boavida LC, Vieira AM, Becker JD, Feijó JA. (2005b) Gametophyte interaction and sexual reproduction: how plants make a zygote. Int J Dev Biol 49: 615–632 - PubMed

Publication types

Associated data