

Human transcriptome array for high-throughput clinical studies
- PMID: 21317363
- PMCID: PMC3048146
- DOI: 10.1073/pnas.1019753108
Human transcriptome array for high-throughput clinical studies
Abstract
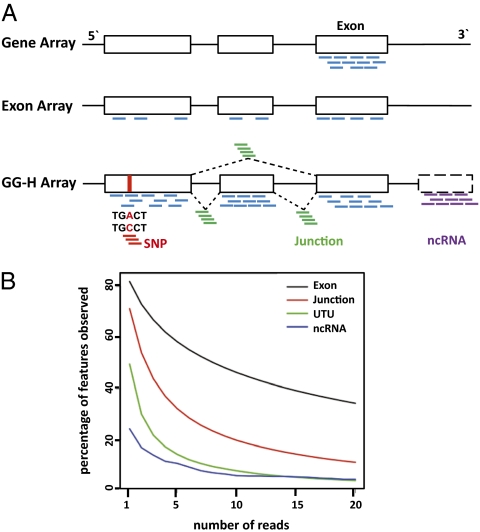
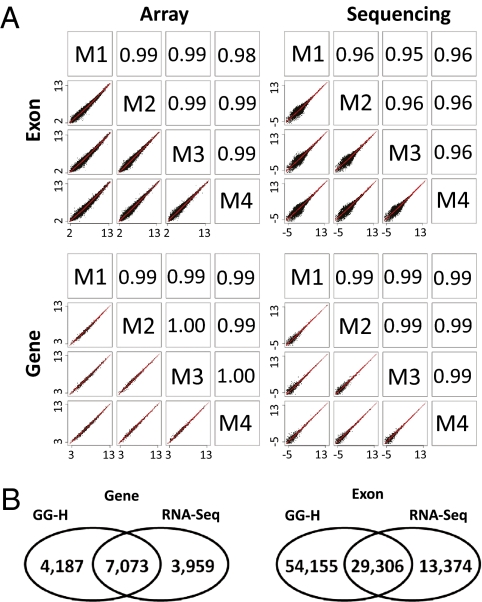
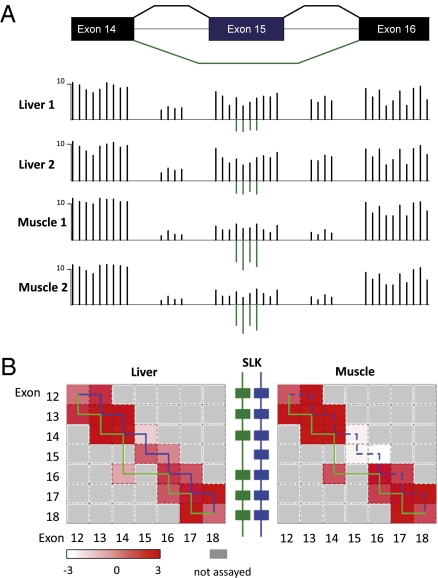
A 6.9 million-feature oligonucleotide array of the human transcriptome [Glue Grant human transcriptome (GG-H array)] has been developed for high-throughput and cost-effective analyses in clinical studies. This array allows comprehensive examination of gene expression and genome-wide identification of alternative splicing as well as detection of coding SNPs and noncoding transcripts. The performance of the array was examined and compared with mRNA sequencing (RNA-Seq) results over multiple independent replicates of liver and muscle samples. Compared with RNA-Seq of 46 million uniquely mappable reads per replicate, the GG-H array is highly reproducible in estimating gene and exon abundance. Although both platforms detect similar expression changes at the gene level, the GG-H array is more sensitive at the exon level. Deeper sequencing is required to adequately cover low-abundance transcripts. The array has been implemented in a multicenter clinical program and has generated high-quality, reproducible data. Considering the clinical trial requirements of cost, sample availability, and throughput, the GG-H array has a wide range of applications. An emerging approach for large-scale clinical genomic studies is to first use RNA-Seq to the sufficient depth for the discovery of transcriptome elements relevant to the disease process followed by high-throughput and reliable screening of these elements on thousands of patient samples using custom-designed arrays.
Conflict of interest statement
The authors declare no conflict of interest.
Figures
References
-
- Schena M, Shalon D, Davis RW, Brown PO. Quantitative monitoring of gene expression patterns with a complementary DNA microarray. Science. 1995;270:467–470. - PubMed
-
- Chee M, et al. Accessing genetic information with high-density DNA arrays. Science. 1996;274:610–614. - PubMed
-
- Golub TR, et al. Molecular classification of cancer: Class discovery and class prediction by gene expression monitoring. Science. 1999;286:531–537. - PubMed
-
- Alizadeh AA, et al. Distinct types of diffuse large B-cell lymphoma identified by gene expression profiling. Nature. 2000;403:503–511. - PubMed
Publication types
MeSH terms
Substances
Associated data
- Actions
- Actions
- Actions
Grants and funding
LinkOut - more resources
Full Text Sources
Other Literature Sources
Medical
Molecular Biology Databases
Miscellaneous
