Review
. 2011 Feb;23(2):431-42.
doi: 10.1105/tpc.110.082784. Epub 2011 Feb 11.

Evolution and functional diversification of MIRNA genes

Affiliations
Review

Evolution and functional diversification of MIRNA genes

Josh T Cuperus et al. Plant Cell. 2011 Feb.

Abstract

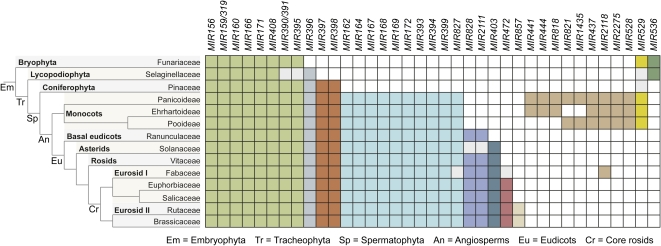
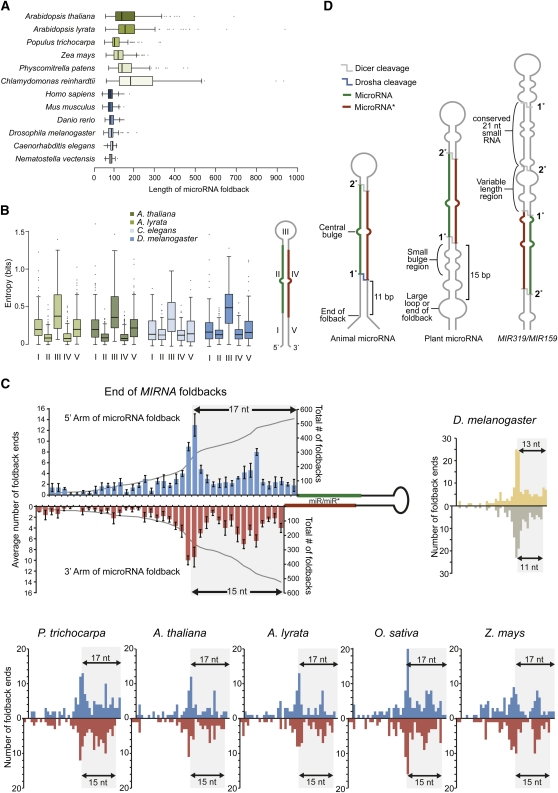
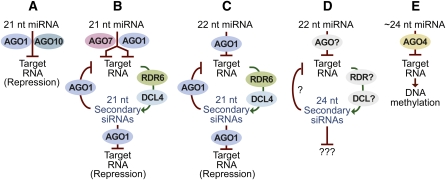
MicroRNAs (miRNAs) are small regulatory RNAs found in diverse eukaryotic lineages. In plants, a minority of annotated MIRNA gene families are conserved between plant families, while the majority are family- or species-specific, suggesting that most known MIRNA genes arose relatively recently in evolutionary time. Given the high proportion of young MIRNA genes in plant species, new MIRNA families are likely spawned and then lost frequently. Unlike highly conserved, ancient miRNAs, young miRNAs are often weakly expressed, processed imprecisely, lack targets, and display patterns of neutral variation, suggesting that young MIRNA loci tend to evolve neutrally. Genome-wide analyses from several plant species have revealed that variation in miRNA foldback expression, structure, processing efficiency, and miRNA size have resulted in the unique functionality of MIRNA loci and resulting miRNAs. Additionally, some miRNAs have evolved specific properties and functions that regulate other transcriptional or posttranscriptional silencing pathways. The evolution of miRNA processing and functional diversity underscores the dynamic nature of miRNA-based regulation in complex regulatory networks.


Figures

Figure 1.
Figure 1.
Deeply Conserved MIRNA Families. MIRNA families (columns) that are conserved between plant families (rows) for plant species represented in miRBase release 16 (Griffiths-Jones et al., 2008). Species- and family-specific MIRNA genes were omitted. Boxes are highlighted if a MIRNA family was identified in at least one species for each of the plant families listed or if the MIRNA family could be identified in the National Center for Biotechnology Information EST or whole-genome shotgun reads databases by BLAST (Altschul et al., 1997). Matches were identified as MIRNA if the sequences containing the putative mature miRNAs could be folded, using RNAfold (Hofacker, 2003), into a stem-loop structure containing the miRNA in the stem. Plant families that may have lost a MIRNA family, or where the family could not confidently be identified, are shaded gray. Groups of MIRNA families are highlighted different colors based on inferred taxonomic range.
Figure 2.
Figure 2.
miRNA Processing in Plants. In the box plots shown in (A) and (B), boxes represent the 25th to 75th percentiles of the data range, and whiskers encompass the most extreme points that are no more than 1.5 times the interquartile range from the box. (A) Predicted length of MIRNA foldbacks in plants and animals. (B) Entropy of MIRNA foldbacks from five distinct regions. A foldback diagram (right) marks the locations of the five regions: I, 5′ arm, loop-distal; II, miRNA; III, loop, 5′ and 3′ arms, loop-proximal; IV, miRNA*; V, 3′ arm, loop-distal. Entropy was calculated per base using the program RNAfold (Hofacker, 2003). The lengths of regions I and V were either 17 and 19 nucleotides, respectively, for plants or 11 and 13 nucleotides, respectively, for Caenorhabditis elegans based on predicted differences in plant and animal miRNA processing from the foldback base. (C) Distribution of large loops (three or more nucleotides [nt]) or ends of helices for foldbacks from 24 deeply conserved MIRNA families in five plant species. Both individual species and combined species data are shown (mean relative levels ± se). The 17/15-nucleotide region shows an enrichment of loops or helix ends in all plants shown, while Drosophila melanogaster large loops or helix ends are enriched at 13/11 nucleotides. The combined plant bar graph is overlaid with the cumulative number of predicted intact foldbacks remaining beyond each position. (D) Illustration of cis-elements involved in animal and plant miRNA foldback processing. Boldface numbers represent initial and secondary processing sites leading to mature small RNAs.
Figure 3.
Figure 3.
Functional Crosstalk of the miRNA Pathway in Plants. Plant miRNA functions include repression of targets, triggering of siRNAs from targets, and triggering of RNA-directed DNA methylation. Pathways A, B, and E have been described in monocots, eudicots, and bryophytes, pathway C in monocots and eudicots, and pathway D only in monocots. nt, Nucleotides.

References

    1. Addo-Quaye C., Eshoo T.W., Bartel D.P., Axtell M.J. (2008). Endogenous siRNA and miRNA targets identified by sequencing of the Arabidopsis degradome. Curr. Biol. 18: 758–762 - PMC - PubMed
    1. Addo-Quaye C., Snyder J.A., Park Y.B., Li Y.F., Sunkar R., Axtell M.J. (2009). Sliced microRNA targets and precise loop-first processing of MIR319 hairpins revealed by analysis of the Physcomitrella patens degradome. RNA 15: 2112–2121 - PMC - PubMed
    1. Allen E., Howell M.D. (2010). miRNAs in the biogenesis of trans-acting siRNAs in higher plants. Semin. Cell Dev. Biol. 21: 798–804 - PubMed
    1. Allen E., Xie Z., Gustafson A.M., Carrington J.C. (2005). microRNA-directed phasing during trans-acting siRNA biogenesis in plants. Cell 121: 207–221 - PubMed
    1. Allen E., Xie Z., Gustafson A.M., Sung G.H., Spatafora J.W., Carrington J.C. (2004). Evolution of microRNA genes by inverted duplication of target gene sequences in Arabidopsis thaliana. Nat. Genet. 36: 1282–1290 - PubMed

LinkOut - more resources