. 2011 Mar;121(3):1217-21.
doi: 10.1172/JCI44635. Epub 2011 Feb 7.

Single cell transcriptional profiling reveals heterogeneity of human induced pluripotent stem cells

Affiliations

Single cell transcriptional profiling reveals heterogeneity of human induced pluripotent stem cells

Kazim H Narsinh et al. J Clin Invest. 2011 Mar.

Abstract

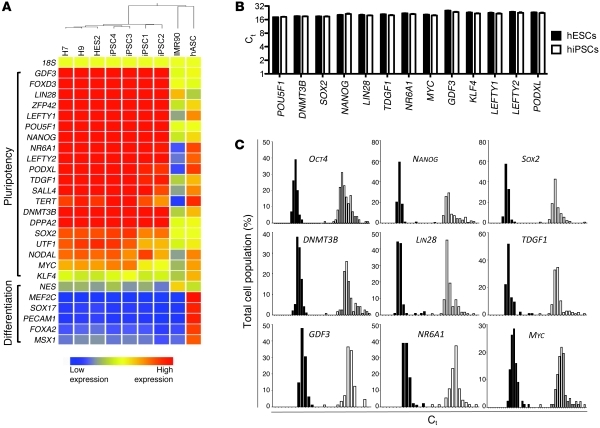
Human induced pluripotent stem cells (hiPSCs) and human embryonic stem cells (hESCs) are promising candidate cell sources for regenerative medicine. However, despite the common ability of hiPSCs and hESCs to differentiate into all 3 germ layers, their functional equivalence at the single cell level remains to be demonstrated. Moreover, single cell heterogeneity amongst stem cell populations may underlie important cell fate decisions. Here, we used single cell analysis to resolve the gene expression profiles of 362 hiPSCs and hESCs for an array of 42 genes that characterize the pluripotent and differentiated states. Comparison between single hESCs and single hiPSCs revealed markedly more heterogeneity in gene expression levels in the hiPSCs, suggesting that hiPSCs occupy an alternate, less stable pluripotent state. hiPSCs also displayed slower growth kinetics and impaired directed differentiation as compared with hESCs. Our results suggest that caution should be exercised before assuming that hiPSCs occupy a pluripotent state equivalent to that of hESCs, particularly when producing differentiated cells for regenerative medicine aims.


Figures

Figure 1
Figure 1. Gene expression profiling of 282 single hESCs and hiPSCs.
(A) An array showing that pluripotency (top) and lineage (bottom) marker transcripts are differentially expressed in pluripotent stem cell types (H7, H9, HES2, hiPSC1–4) versus somatic cell types (IMR90 and hASCs). (B) Comparison of the Ct values obtained by single cell qRT-PCR shows that pluripotency transcript levels are equivalent when considering the cell populations as a whole (geometric mean ± SD). (C) Population distribution plots (horizontal axis represents Ct value; vertical axis represents percentage of total cell population) reveal that single hiPSCs (white bars) display considerable heterogeneity in transcript expression levels in comparison with that of single hESCs (black bars).
Figure 2
Figure 2. Immunophenotypic and positional variation in single cell gene expression.
(A) Gene expression profiling of single hiPSCs expressing the Tra-1-60+/SSEA-4+ immunophenotype. Heat map representations of gene expression levels in immunophenotyped hESCs and hiPSCs versus differentiated fibroblast cells (IMR90), with each column representing a single cell. Single hESCs (left) show minimal heterogeneity, while single hiPSCs (middle) show increased variability in comparison with 4 somatic IMR90 cells (right), with no segregation of cells according to cell line when subjected to a hierarchical clustering algorithm. A gradient of hiPSC expression is evident, with cells expressing low levels of pluripotency transcripts enriched to the right. (B and C) Positional variation in transcript expression levels within pluripotent stem cell colonies. (B) A positional gradient of expression is evident in both hESCs and hiPSCs, with lower expression of pluripotency transcripts observed in the periphery of the colony. (C) Expression levels of ectoderm (PAX6 and NES), early mesoderm (GATA4), and endoderm (SOX17) transcripts are uniform across hESC colonies. However, the periphery of hiPSC colonies has undergone relative downregulation of endoderm marker SOX17 and relative upregulation of ectoderm marker PAX6.
Figure 3
Figure 3. Limited growth and differentiation potential of hiPSC-derived cells.
(A) Representative bioluminescence images of immunocompromised SCID beige mice implanted with 106 hESCs or 106 hiPSCs stably expressing firefly luciferase reporter construct. (B) Quantitative analysis of bioluminescence imaging data shows slower teratoma growth kinetics of hiPSC-derived teratomas (mean ± SEM for n = 10). sr, steradian. (C) Immunostaining for cardiac troponin T (cTnT) of hESC- and hiPSC-derived cardiomyocytes (original magnification, ×20). (D) Assessment of the percentage of cell aggregates containing beating cardiomyocytes after 14 days shows substantial variation in the yield of hiPSC-CMs, while the yield of hESC-CMs is stable (mean ± SEM for n = 8). (E) Immunostaining for CD31 (left) and CD144 (top right) EC markers and robust LDL uptake (bottom right) for hESC-derived ECs after 14 days of differentiation before (bottom left) and after (top left and top right) FACS enrichment (original magnification, ×20). (F) Cell proliferation and CD31 expression over 2–3 weeks after isolation of EC populations show limited stability and proliferative capacity of hiPSC-ECs in comparison with hESC-ECs (mean ± SD for n = 4).

References

    1. Takahashi K, et al. Induction of pluripotent stem cells from adult human fibroblasts by defined factors. Cell. 2007;131(5):861–872. doi: 10.1016/j.cell.2007.11.019. - DOI - PubMed
    1. Yu J, et al. Induced pluripotent stem cell lines derived from human somatic cells. Science. 2007;318(5858):1917–1920. - PubMed
    1. Boheler KR. Pluripotency of human embryonic and induced pluripotent stem cells for cardiac and vascular regeneration. Thromb Haemost. 2010;104(1):23–29. - PMC - PubMed
    1. Enver T, Pera M, Peterson C, Andrews PW. Stem cell states, fates, and the rules of attraction. Cell Stem Cell. 2009;4(5):387–397. doi: 10.1016/j.stem.2009.04.011. - DOI - PubMed
    1. Guo G, et al. Resolution of cell fate decisions revealed by single-cell gene expression analysis from zygote to blastocyst. Dev Cell. 2010;18(4):675–685. doi: 10.1016/j.devcel.2010.02.012. - DOI - PubMed

Publication types

MeSH terms