. 2011 Mar;121(3):851-65.
doi: 10.1172/JCI44111. Epub 2011 Feb 7.

Subunit 6 of the COP9 signalosome promotes tumorigenesis in mice through stabilization of MDM2 and is upregulated in human cancers

Affiliations

Subunit 6 of the COP9 signalosome promotes tumorigenesis in mice through stabilization of MDM2 and is upregulated in human cancers

Ruiying Zhao et al. J Clin Invest. 2011 Mar.

Abstract

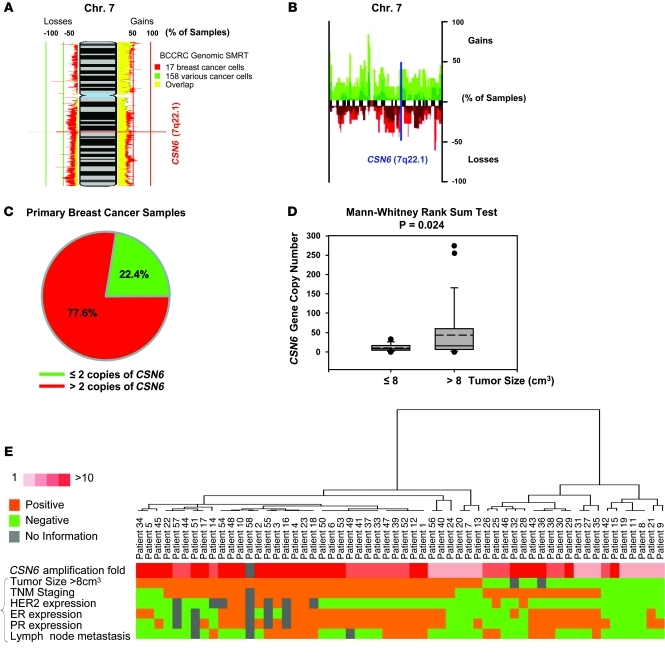
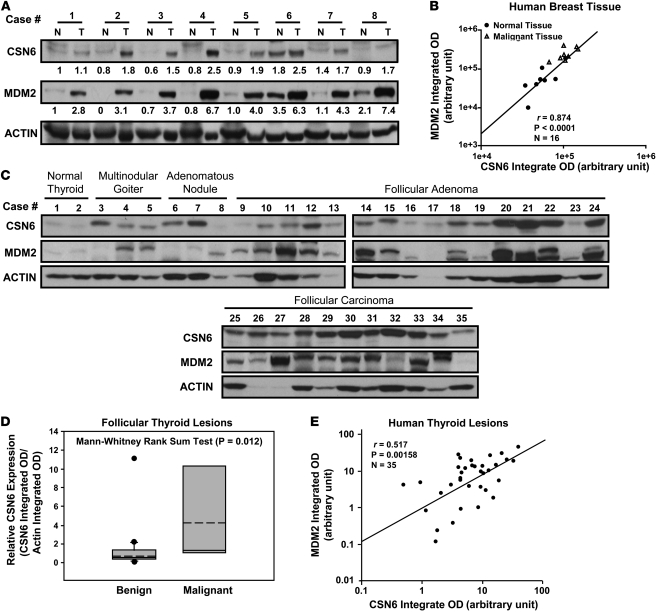
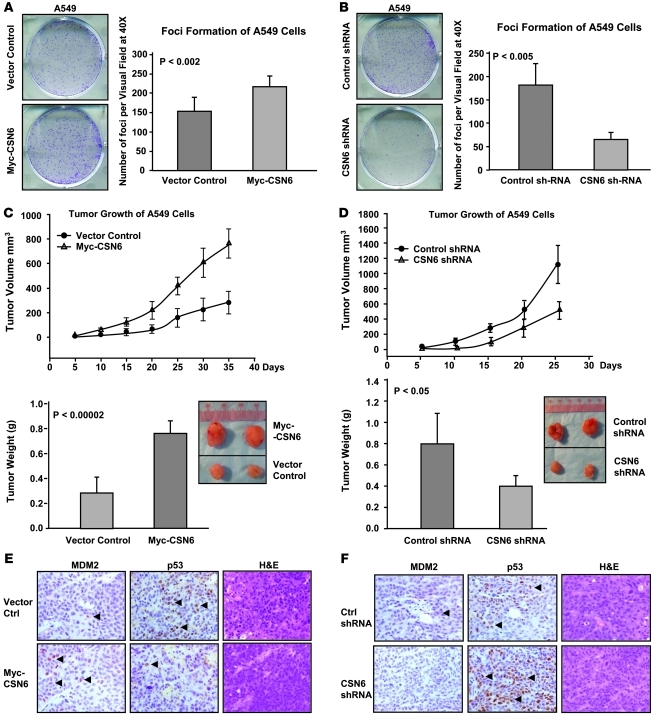
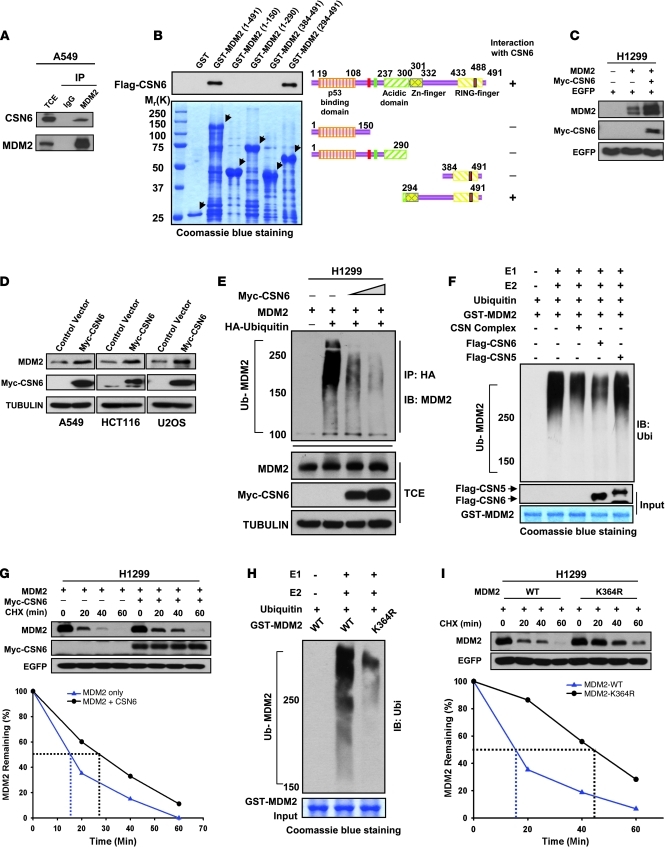
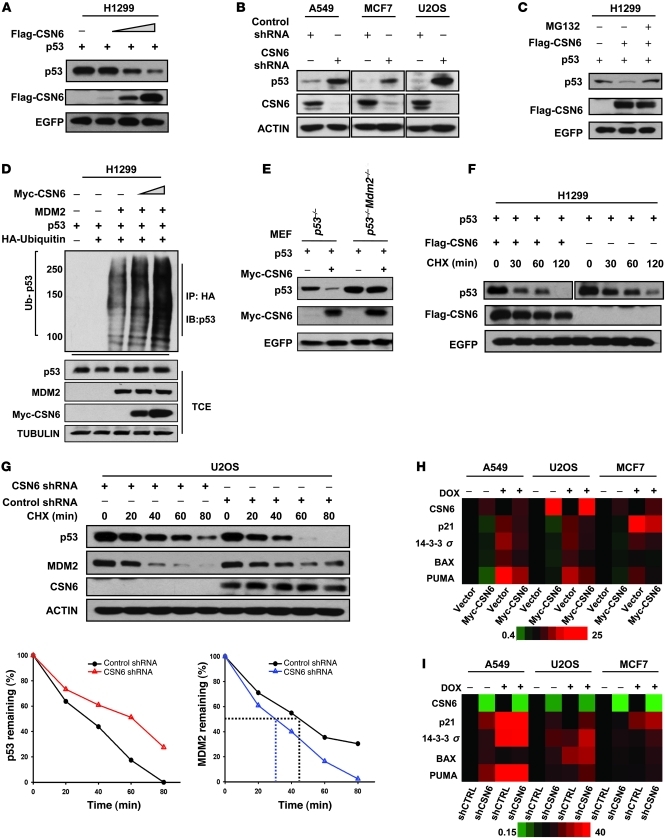
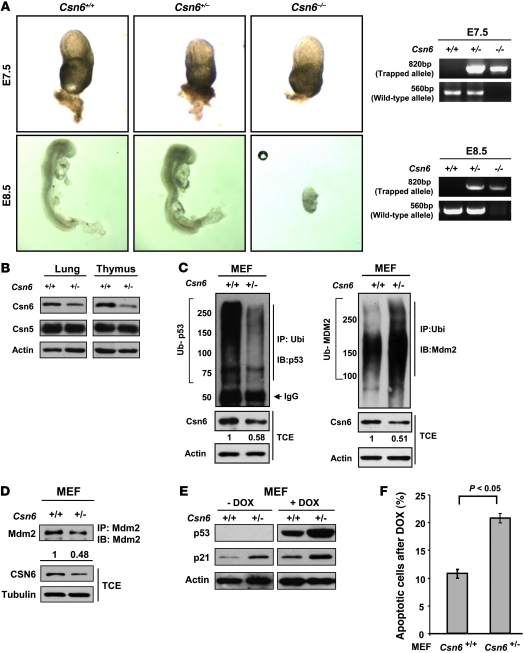
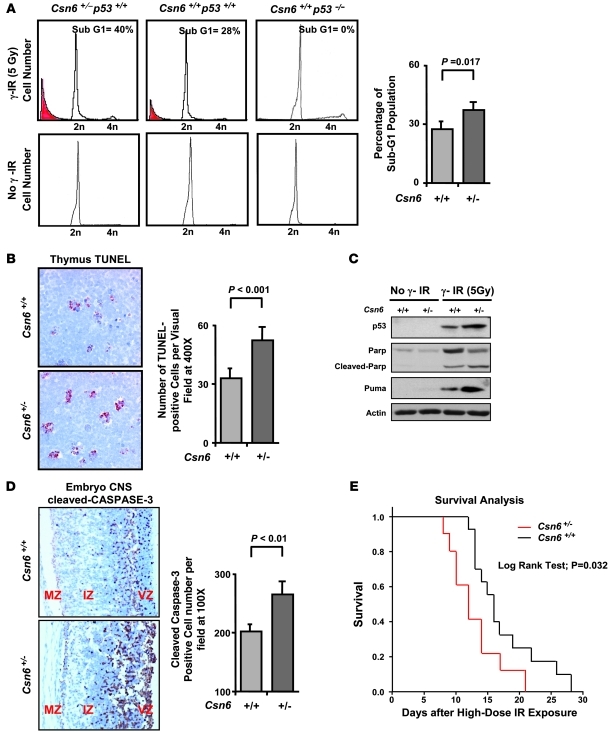
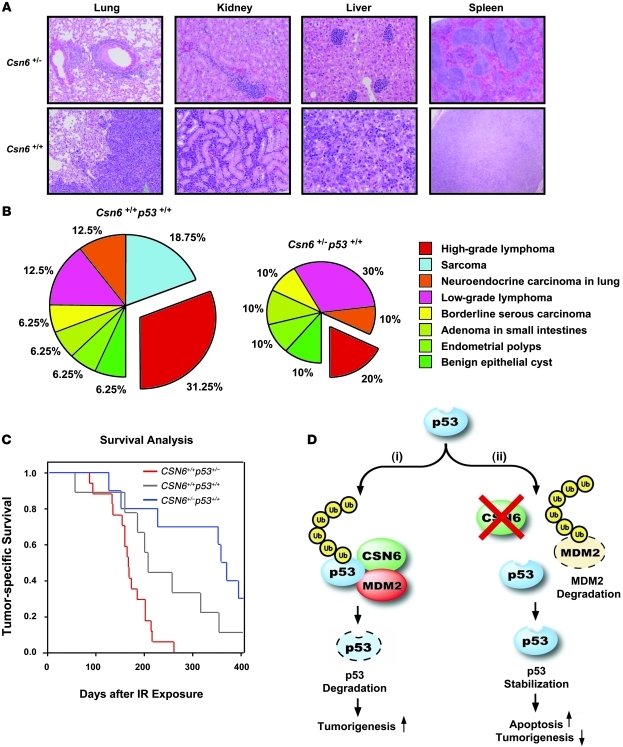
The mammalian constitutive photomorphogenesis 9 (COP9) signalosome (CSN), a protein complex involved in embryonic development, is implicated in cell cycle regulation and the DNA damage response. Its role in tumor development, however, remains unclear. Here, we have shown that the COP9 subunit 6 (CSN6) gene is amplified in human breast cancer specimens, and the CSN6 protein is upregulated in human breast and thyroid tumors. CSN6 expression positively correlated with expression of murine double minute 2 (MDM2), a potent negative regulator of the p53 tumor suppressor. Expression of CSN6 appeared to prevent MDM2 autoubiquitination at lysine 364, resulting in stabilization of MDM2 and degradation of p53. Mice in which Csn6 was deleted died early in embryogenesis (E7.5). Embryos lacking both Csn6 and p53 survived to later in embryonic development (E10.5), which suggests that loss of p53 could partially rescue the effect of loss of Csn6. Mice heterozygous for Csn6 were sensitized to γ-irradiation-induced, p53-dependent apoptosis in both the thymus and the developing CNS. These mice were also less susceptible than wild-type mice to γ-irradiation-induced tumorigenesis. These results suggest that loss of CSN6 enhances p53-mediated tumor suppression in vivo and that CSN6 plays an important role in regulating DNA damage-associated apoptosis and tumorigenesis through control of the MDM2-p53 signaling pathway.


Figures

Figure 1
Figure 1. Amplification of CSN6 gene copy number in human breast cancers.
(A) SIGMA analysis of the CSN6 gene loci was performed on a CGH data set of BCCRC SMRT arrays. 100%, gain of that locus in all samples; –100%, loss of that locus in all samples. (B) Regions of gains and loss (at 0.9 megabase resolution) across chromosome 7 in a set of 47 primary breast cancer samples and 18 breast cancer cell lines are shown. Figure adapted from Breast Cancer Research (31). Red, recurrent loss, green, recurrent gain. (C) CSN6 gene copies were assessed in a cohort of 58 primary human breast cancer genomic DNA samples, and the frequency of human breast cancer samples with or without CSN6 gene amplification is shown. (D) Amplification of the CSN6 gene was associated with tumor size larger than 8 cm3 at the time of surgical resection in the cohort examined in C. Bounds of the boxes denote interquartile range; solid and dashed lines denote median and mean, respectively; whiskers denote 90% and 10%; symbols denote outliers. (E) Hierarchical clustering was performed on the cohort examined in C with the indicated pathological and genomic markers; data are presented as a heat map.
Figure 2
Figure 2. Overexpression of both CSN6 and MDM2 in human breast cancer and follicular thyroid carcinoma.
(A) Expression status of CSN6 and MDM2 in matched normal (N) and cancerous (T) regions isolated from breast cancer patients. Protein amounts (relative to the integrated OD of the actin band) are shown below each CSN6 and MDM2 band. (B) Integrated OD of MDM2 bands in A versus that of the CSN6 bands from the corresponding sample. There was a positive correlation between CSN6 and MDM2 in terms of protein levels. (C) Human thyroid tissue samples were analyzed for expression of MDM2 and CSN6 proteins. 10 cases of follicular carcinomas, 22 cases of benign thyroid lesions, and 2 samples of normal thyroid tissue were analyzed. (D) Integrated OD of CSN6 bands in C. CSN6 expression (relative to actin) in benign thyroid tissues and malignant follicular thyroid samples is shown. Bounds of the boxes denote interquartile range; solid and dashed lines denote median and mean, respectively; whiskers denote 90% and 10%; symbols denote outliers. (E) Scatter plot of the integrated OD of MDM2 bands in C versus that of CSN6 bands from the corresponding thyroid tissue sample. There was a positive correlation between CSN6 and MDM2 in terms of protein levels.
Figure 3
Figure 3. CSN6 promotes tumorigenesis by regulating the p53-MDM2 axis.
(A) Overexpression of CSN6 promoted the cell transformation. Myc-CSN6–overexpressing A549 stable transfectants and vector controls were subjected to microfoci formation assay. Number of colonies per field was measured. P values were determined by 2-tailed t test. (B) Knockdown of CSN6 inhibited the cell transformation. CSN6 shRNA or control shRNA A549 stable transfectants were subjected to microfoci formation assay. Number of colonies per field was measured. (C) Overexpression of CSN6 promoted tumorigenicity. Myc-CSN6–overexpressing A549 stable transfectants and vector controls were subcutaneously injected into nude mice. Tumor growth curves are shown. Tumors were isolated at the end of the assay, and the tumor weight of each group was measured. Representative tumor sizes are shown. (D) Knockdown of CSN6 inhibited tumorigenicity. CSN6 shRNA or control shRNA A549 stable transfectants were subcutaneously injected into nude mice. Tumor growth curves are shown. Tumors were isolated at the end of the assay, and the tumor weight of each group was measured. Representative tumor sizes are shown. (E) Overexpression of CSN6 enhanced MDM2 expression, but decreased p53 expression, in tumors. Tumors were collected as described in C. Representative tumor sections are shown (original magnification, ×200). (F) Knockdown of CSN6 diminished MDM2 expression, but enhanced p53 expression, in tumors. Tumors were collected as described in D. Representative tumor sections are shown (original magnification, ×200).
Figure 4
Figure 4. CSN6 increases the stability of MDM2.
(A) CSN6 interacted with MDM2. Lysates of A549 cells were immunoprecipitated and analyzed with the indicated antibodies. TCE, total cellular extracts. (B) Mapping of the CSN6 binding region within MDM2. Purified GST-MDM2 domains and Flag-CSN6 were subjected to GST-pulldown assay. Specific interactions of MDM2 deletions with CSN6 are indicated. (C) Ectopic expression of CSN6 increased the steady-state protein level of MDM2. EGFP served as a transfection efficiency control as well as a loading control. (D) Enforced expression of CSN6 increased the protein level of MDM2. Myc-CSN6–overexpressing A549, HCT116, and U2OS stable transfectants and vector controls were checked for endogenous MDM2 expression. (E) CSN6 diminished the ubiquitination level of MDM2 in vivo. HA-ubiquitinated MDM2 was immunoprecipitated with anti-HA, then probed with anti-MDM2. Equal amounts of TCE were immunoblotted with the indicated antibodies. (F) CSN6 reduced the ubiquitination level of MDM2 in vitro. GST-MDM2 was incubated with purified Flag-CSN6 or Flag-CSN5 or CSN complex in the presence of E1, E2, and His-Ubiquitin as indicated. (G) CSN6 reduced MDM2 turnover. Cells were treated with 100 μg/ml CHX for the indicated durations. Integrated OD values of MDM2 at each time point were measured. Remaining MDM2 relative to time 0 (set at 100%) is indicated. (H) K364R mutation of MDM2 attenuated the autoubiquitination of MDM2 in vitro. Wild-type and K364R mutant GST-MDM2 or GST-MDM2 were incubated with E1, E2, and His-Ubiquitin as indicated. (I) K364R MDM2 mutant had an extended half-life compared with wild-type MDM2. Remaining MDM2 is indicated.
Figure 5
Figure 5. CSN6 facilitates the degradation of p53.
(A) CSN6 reduces the steady-state protein level of p53. Equal amounts of protein were analyzed with the indicated antibodies. (B) p53 protein level was upregulated with loss of CSN6. Protein levels of p53 and CSN6 were analyzed in various cells subjected to CSN6 shRNA or control shRNA. (C) Proteasome inhibitor blocked CSN6-mediated degradation of p53. H1299 cells were treated with or without proteasome inhibitor MG132 (50 μg/ml, 6 hours), then immunoblotted with the indicated antibodies. (D) CSN6 enhanced MDM2-mediated p53 ubiquitination. HA-ubiquitinated p53 was immunoprecipitated with anti-HA and probed with anti-p53. Equal amounts of TCE were immunoblotted with indicated antibodies. (E) CSN6-mediated destabilization of p53 is MDM2 dependent. p53–/– or p53–/–Mdm2–/– MEFs were transfected with the indicated plasmids, then analyzed with the indicated antibodies. (F) CSN6 increased the turnover rate of p53. H1299 cells were transfected with the indicated plasmids, then checked with the indicated antibodies. (G) CSN6 knockdown increased MDM2 turnover but reduced p53 turnover. U2OS cells were subjected to control shRNA or CSN6 shRNA. MDM2 or p53 remaining is indicated. (H) Enhanced expression of CSN6 impaired p53 transcriptional activation, as determined by quantitative RT-PCR in the presence or absence of DOX (1 μg/ml). Expression levels of the indicated p53 target genes were quantitated and presented as a heat map. (I) Knockdown of CSN6 potentiated p53 transcriptional activation, as determined by quantitative RT-PCR in the presence or absence of DOX (1 μg/ml). Expression levels of the indicated p53 target genes were quantitated and presented as a heat map.
Figure 6
Figure 6. Csn6-deficient mice die in early embryogenesis.
(A) Representative phenotypes of Csn6–/– mouse embryos at different embryonic stages. Note that the Csn6–/– embryo had normal size and appearance on E7.5, but empty deciduae with little embryonic tissue were found on E8.5. Representative PCR genotyping results of these embryos are shown. (B) Csn6 protein expression in representative tissues of Csn6+/– and Csn6+/+ mice. (C) Ubiquitination status of p53 and Mdm2 in primary Csn6+/– and Csn6+/+ MEFs. Polyubiquitinated p53 or polyubiquitinated Mdm2 was immunoprecipitated with anti-p53 or anti-Mdm2, then probed with anti-ubiquitin. Equal amounts of TCE were immunoblotted with the indicated antibodies. (D) Reduced Mdm2 protein level in Csn6+/– MEFs. Endogenous Mdm2 was immunoprecipitated from primary MEFs, then probed with anti-Mdm2. Equal amounts of TCE were immunoblotted with the indicated antibodies. (E) Loss of Csn6 sensitized MEF cells to DOX-induced activation of p53. Primary MEFs from the same littermates were treated with and without DOX (1 μg/ml). Equal amounts of proteins from cell lysates were immunoblotted with the indicated antibodies. (F) Csn6 haploinsufficiency sensitized MEFs to DOX-induced apoptosis. Percent apoptotic population in each group was measured. P values were determined by 2-tailed t test.
Figure 7
Figure 7. Csn6 is essential for γ-IR–induced apoptosis in the mouse thymus and developing CNS.
(A) FACS analysis for detection of apoptotic thymocytes of Csn6+/– and Csn6+/+ mice after γ-IR. Thymocytes with sub-G1 DNA (red) content were apoptotic. Percent sub-G1 population in each sample was measured. P values were determined by 2-tailed t test. (B) TUNEL analysis of thymus sections in Csn6+/– and Csn6+/+ mice after γ-IR. Mice were treated as in A. Apoptosis was analyzed by TUNEL assay in the thymus sections (original magnification, ×400). Number of TUNEL+ cells per field was measured. P values were determined by 2-tailed t test. (C) Increased Puma expression and Parp cleavage in Csn6+/– thymocytes upon γ-IR. Thymocytes were treated as in A, then subjected to immunoblots with indicated antibodies. (D) CNS of embryos assayed for apoptosis by cleaved caspase-3 staining. Sagittal sections of embryos were stained for cleaved caspase-3 (original magnification, ×100). Ventricular zone (VZ), intermediate zone (IZ), and marginal zone (MZ) of the CNS are indicated. Number of cleaved caspase-3+ cells per field was measured. P values were determined by 2-tailed t test. (E) Kaplan-Meier survival curves for Csn6+/– and Csn6+/+ mice subjected to γ-IR. 5-week-old littermates were given TBI at a dose of 7.5 Gy. Mouse survival was monitored for 30 days.
Figure 8
Figure 8. Csn6 haploinsufficiency inhibits γ-IR–induced tumorigenesis in mice.
(A) H&E-stained sections of lung, kidney, liver, and spleen from moribund mice after 4.5 Gy γ-IR showed different degrees of lymphocyte infiltration. Csn6+/+ mice suffered with high-grade lymphoma while age-matched Csn6+/– littermates showed atypical lymphoid proliferation. Original magnification, ×100 (lung, kidney, and liver); ×40 (spleen). (B) Tumor spectra in Csn6+/– and Csn6+/+ mice after γ-IR. Pie charts show relative frequency of tumor types observed. c2 test showed a significant difference (P = 0.024) in the proportions of different tumors between the 2 genotypes. Data represent the total number of neoplasms detected. (C) Tumor-specific survival of Csn6+/+p53+/+, Csn6+/–p53+/+, and Csn6+/+p53+/– mice after 4.5 Gy γ-IR. Kaplan-Meier survival curves of age-matched littermates are shown. P < 0.05, log-rank test. (D) Role of CSN6 in modulating MDM2 stability, p53-dependent apoptosis, and tumorigenesis. The presence of CSN6 (i) stabilizes MDM2, leading to p53 degradation and susceptibility to γ-IR–induced tumorigenesis. The absence of CSN6 (ii) results in decreased MDM2 and increased p53, enhancing p53-mediated apoptosis and tumor suppression.

Similar articles

Cited by

References

    1. Wei N, Deng XW. COP9: a new genetic locus involved in light-regulated development and gene expression in arabidopsis. Plant Cell. 1992;4(12):1507–1518. - PMC - PubMed
    1. Li L, Deng XW. The COP9 signalosome: an alternative lid for the 26S proteasome? Trends Cell Biol. 2003;13(10):507–509. doi: 10.1016/j.tcb.2003.08.002. - DOI - PubMed
    1. Cope GA, Deshaies RJ. COP9 signalosome: a multifunctional regulator of SCF and other cullin-based ubiquitin ligases. Cell. 2003;114(6):663–671. doi: 10.1016/S0092-8674(03)00722-0. - DOI - PubMed
    1. Cope GA, et al. Role of predicted metalloprotease motif of Jab1/Csn5 in cleavage of Nedd8 from Cul1. Science. 2002;298(5593):608–611. doi: 10.1126/science.1075901. - DOI - PubMed
    1. Yang X, et al. The COP9 signalosome inhibits p27(kip1) degradation and impedes G1-S phase progression via deneddylation of SCF Cul1. Curr Biol. 2002;12(8):667–672. doi: 10.1016/S0960-9822(02)00791-1. - DOI - PubMed

Publication types